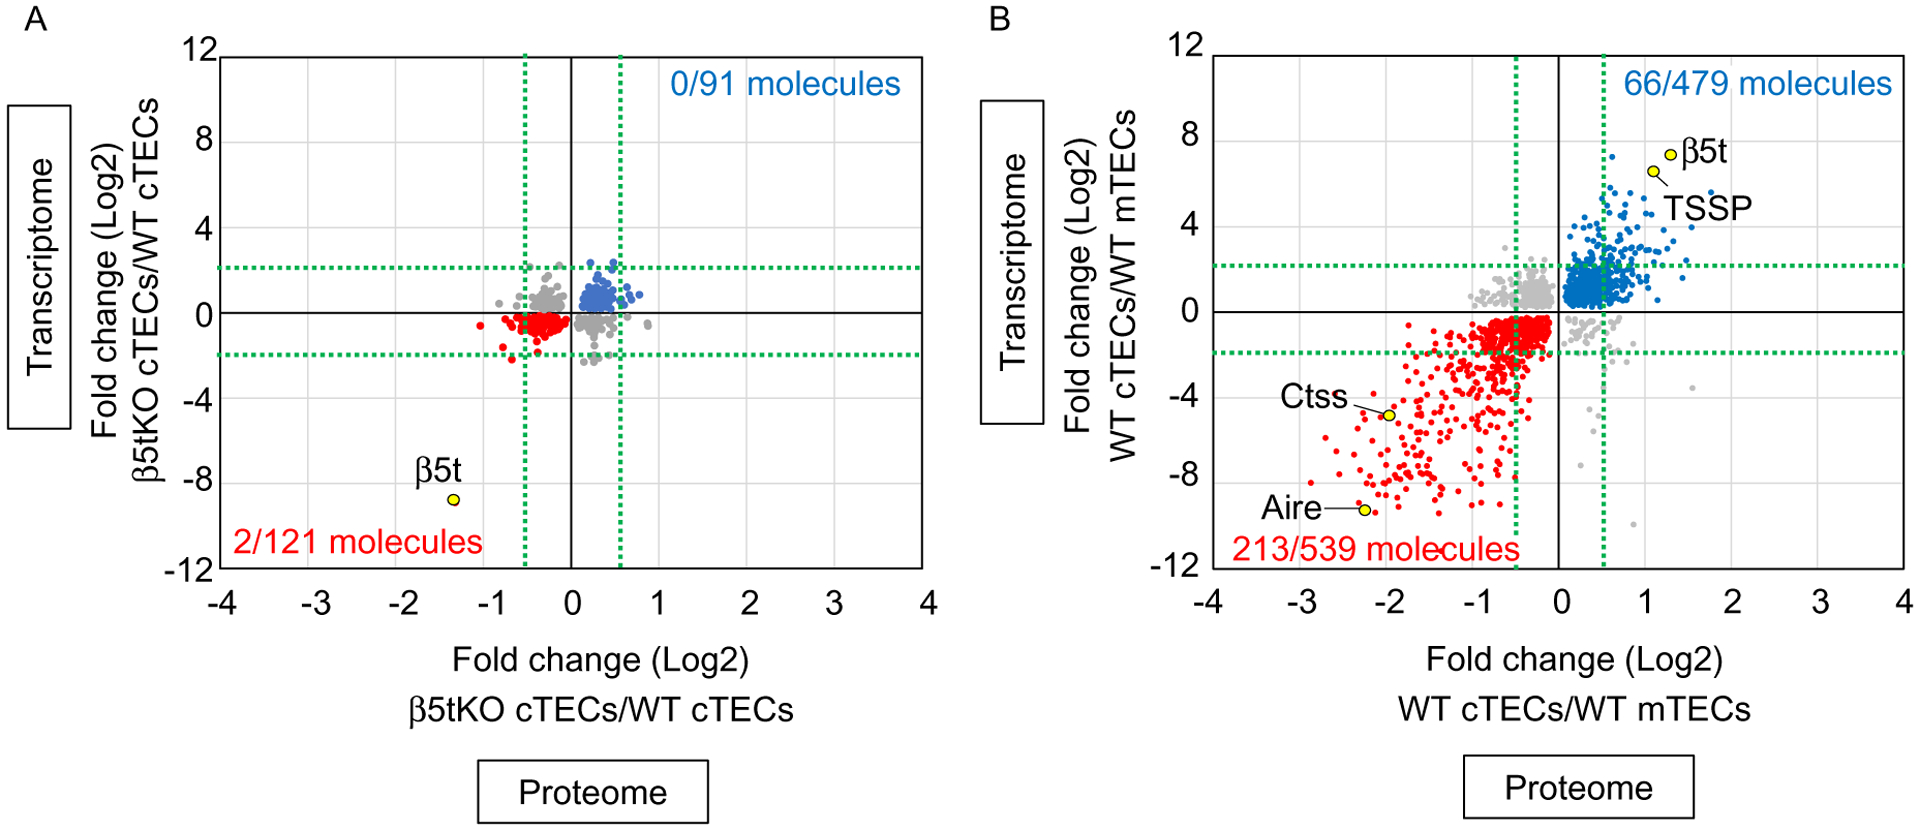
Fig. 1.

Trans-omics analysis of TECs. Correlation plot analysis of trans-omic (proteomic and transcriptomic) profiles for (A) β5t-deficient cTECs and wildtype (WT) cTECs and (B) WT cTECs and WT mTECs. (A) Among 91 molecules (blue symbols) that were more highly detected (P<0.05) in β5t-deficient cTECs than in WT cTECs in both proteomic and transcriptomic data, none of the molecules showed the fold changes in proteomic data >0.5 and transcriptomic data >2 (indicated by green dot lines). Among 121 molecules (red symbols) that were more highly detected (P<0.05) in WT cTECs than in β5t-deficient cTECs in both proteomic and transcriptomic data, 2 molecules showed the fold changes in proteomic data <−0.5 and transcriptomic data <−2. Among these 2 molecules, only one molecule β5t showed a reproducible reduction in β5t-deficient cTECs in individual quantitative analysis. (B) In the parallel analysis using the same threshold setting, among 479 molecules (blue symbols) that were more highly detected in cTECs than in mTECs, 66 molecules showed the fold changes in proteomic data >0.5 and transcriptomic data >2 (indicated by green dot lines). Among 539 molecules (red symbols) that were more highly detected in mTECs than in cTECs, 213 molecules showed the fold changes in proteomic data <−0.5 and transcriptomic data <−2.
