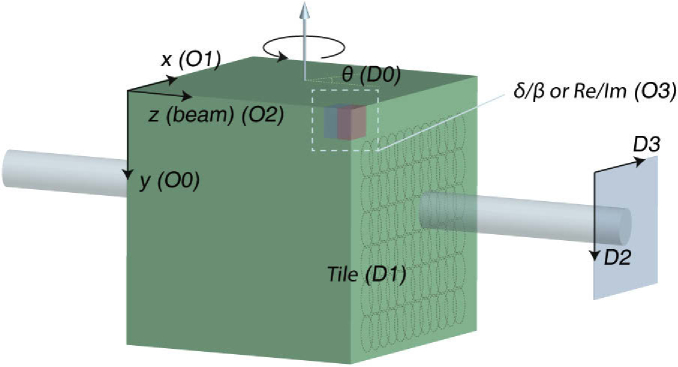
Fig. 3.
Representation of experimental coordinates in Adorym’s readable dataset () and object function array (). Directions and quantities are labeled with the index of dimension in the corresponding array; for example, means that the associated object axis is stored as the 2nd dimension of the object array.

