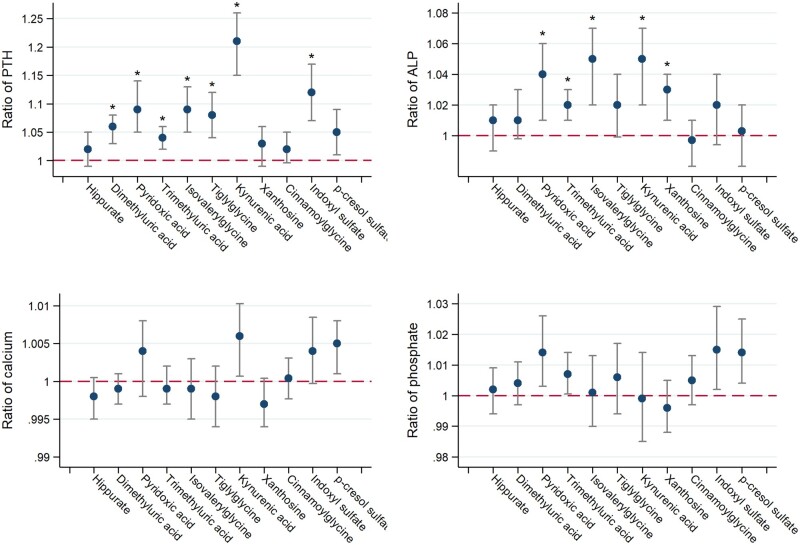
FIGURE 2.
Adjusted associations of secretory solute clearances with markers of mineral metabolism. Model adjusted for log-transformed i GFR, log-transformed 24-h urinary albumin excretion, age, race, sex, attained education, current smoking status, BMI, diabetes mellitus, serum calcium (not in the calcium model), serum phosphate (not in the phosphate model), and the use of active vitamin D, phosphate binders and calciferols. Ratio expressed per 50% lower clearance of each individual solute (log-transformed). Conversion factors for units: calcium in mg/dL to mmol/L, ×0.2495; phosphate in mg/dL to mmol/L, ×0.3229. Asterisks denote statistical significance after correction for multiple comparisons using the Hommel method.

