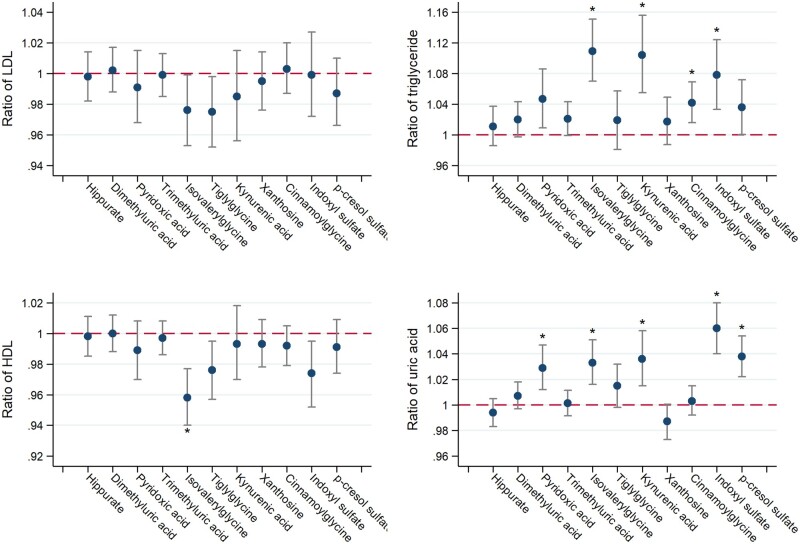
FIGURE 3.
Adjusted associations of secretory solute clearances with markers of lipid metabolism and uric acid. Model adjusted for log-transformed iGFR, log-transformed 24-h urinary albumin, age, race, sex, attained education, current smoking status, BMI, diabetes mellitus, waist circumference, physical activity levels, hemoglobin A1C, statins, non-statin lipid-lowering medications, thiazide diuretics and allopurinol. Ratio expressed per 50% lower clearance of each individual solute (log-transformed). Conversion factors for units: LDL in mg/dL to mmol/L, ×0.02586; triglyceride in mg/dL to mmol/L, ×0.01129; HDL in mg/dL to mmol/L, ×0.02586; uric acid in mg/dL to μmol/L, ×59.48. Asterisks denote statistical significance after correction for multiple comparisons using the Hommel method.

