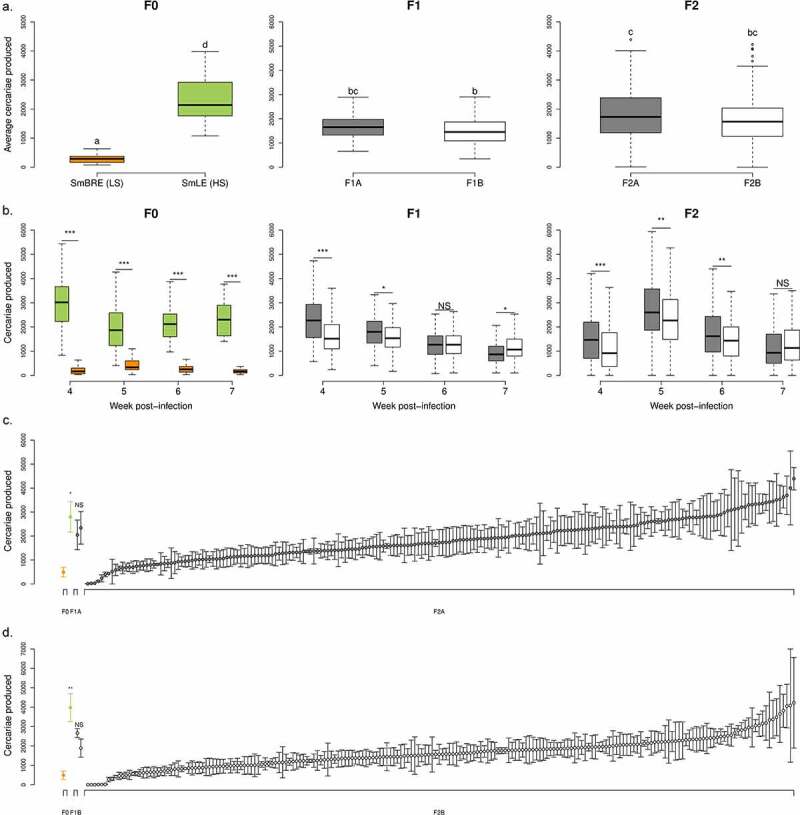
Figure 2.

Transmission stage production of two Schistosoma mansoni parental populations (SmLE-H and SmBRE-L) and their progeny (F1s and F2s). (a) Difference in the average number of cercariae produced by SmLE-H and SmBRE-L S. mansoni populations during 4 weeks of the patent period (week 4 to 7 post infection). The SmLE-H population (N = 46) shed more cercariae than the SmBRE-L population (N = 48) [5]. For both crosses A and B, F1 populations (F1A: N = 102; F1B: N = 110) exhibited an intermediate phenotype in terms of cercarial production, compared to F0, while the average production of cercariae by F2s (F2A: N = 204; F2B: N = 204) encompassed both parental and F1s distributions. Cercarial productions from parasite populations or generations not connected by the same letter are significantly different (post-hoc test). (b) Difference in the number of cercariae produced by S. mansoni parental populations (SmLE-H and SmBRE-L) and progeny (F1 and F2) measured by week (week 4 to 7 post infection). (c) Distribution of the cercarial production (mean ± SE) over the 4 weeks of the patent period for the parents (F0) of the cross A, the F1 parents (F1A) and the 204 F2A progeny in rank order. (d) Distribution plot of the cercarial production for the parents (F0), the F1 parents (F1B) and all the 204 F2B progeny for the cross B in rank order. For both crosses (c-d), SmBRE-L and SmLE-H F0 parents exhibited striking differences in cercarial production (cross A: Welsh t-test, p = 0.031; cross B: Welsh t-test, p = 0.013) while F1 showed an intermediate phenotype and F2 encompassed both parental distribution with a gradation from L to H phenotype. NS: No significant difference in cercarial production between the two considered groups, * p < 0.05, ** p ≤ 0.02, *** p ≤ 0.002
