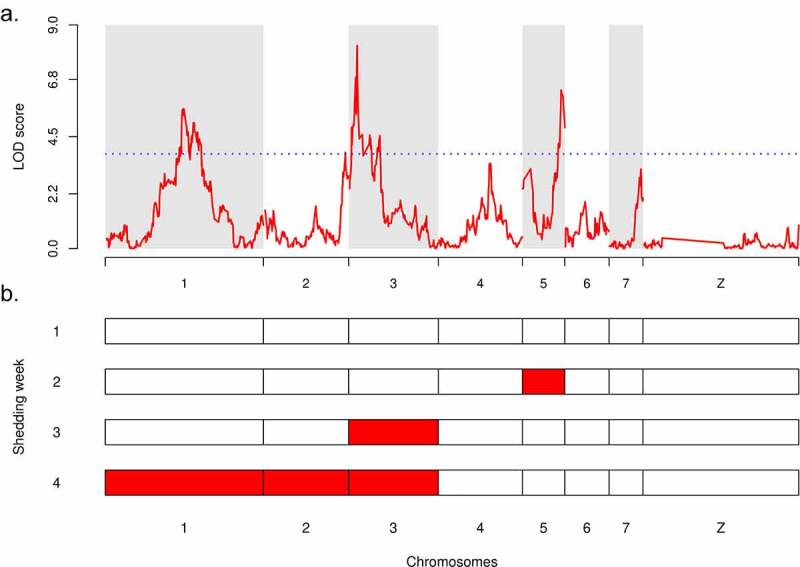
Figure 3.

Linkage analysis of the transmission stage production in S. mansoni parasites and QTLs interactions. (a) Linkage analysis of average cercarial production phenotype in combined crosses A and B demonstrated that transmission stage production is a polygenic trait controlled by three major QTLs with statistically significant LOD: on chr. 1 (LOD = 5.63), on chr. 2 (LOD = 8.16) and on chr. 5 (LOD = 6.37). The blue dotted line represents the 1,000 permutation threshold. (b) Genetic architecture of cercarial production is influenced by the shedding week (first shedding week corresponds to week 4 post-infection), demonstrating a sequential pattern of QTL emergence involved in transmission stage production (see also Supplementary Figure 4)
