
Fig. 2.
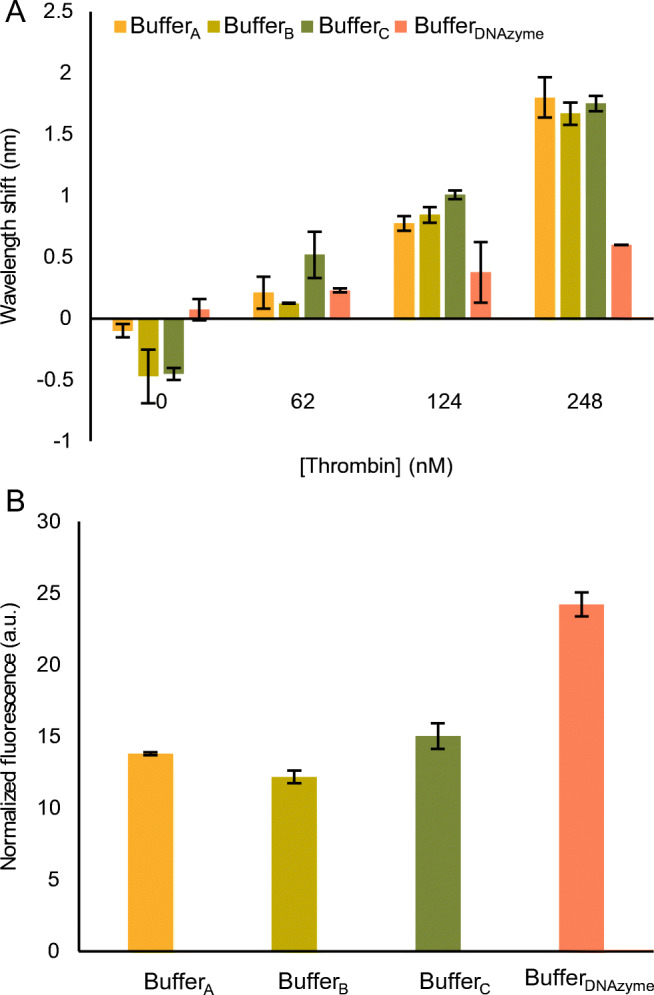
Performance of the aptazyme components in various buffers. A Performance of TBA15, immobilized on the FO-SPR sensor, obtained by measuring the wavelength shift in the presence of a dilution series of thrombin. B Fluorescence signal generated by DNAzyme1 (250 nM) in the presence of Substrate1 (250 nM) as measured on the microplate reader. The error bars in A and B represent the standard deviations of two and three repetitions, respectively