
Fig. 4.
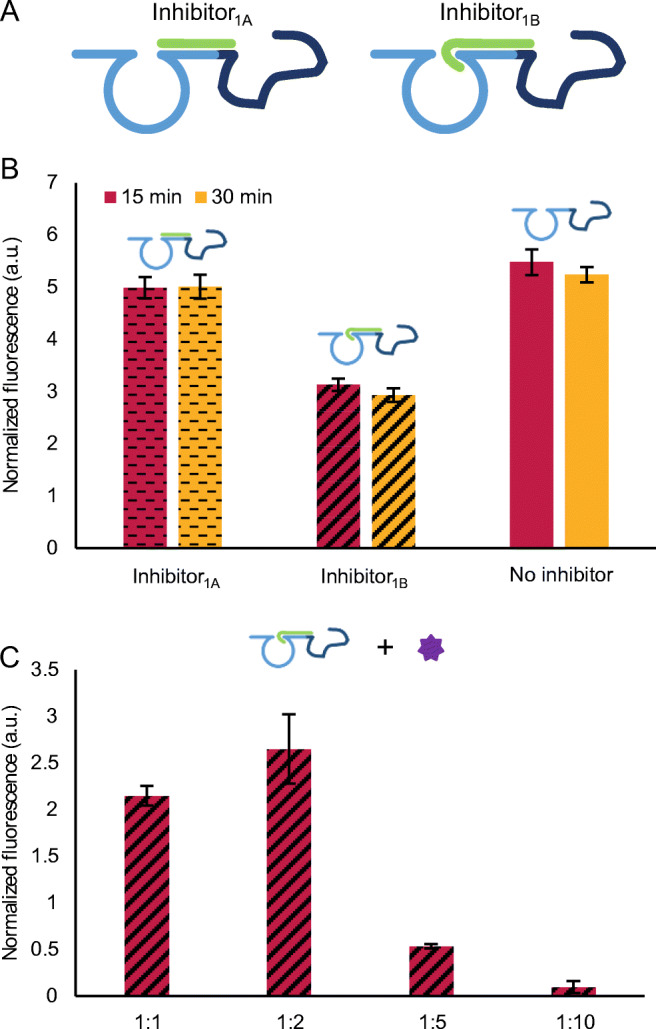
Optimization of the inhibition of Aptazyme1.15-3’. A Schematic representation of the two inhibitory sequences, Inhibitor1A and Inhibitor1B. B Testing two inhibitory sequences at two hybridization times (15 and 30 min) at 250 nM of Aptazyme15- 3’ and 2500 nM of Inhibitor1A or Inhibitor1B. The generated fluorescence signal was recorded upon addition of 250 nM of Substrate1. C Testing the capacity of thrombin (248 nM) to reactivate Aptazyme1.15-3’ inhibited with Inhibitor1B in different ratios (1:1, 1:2, 1:5, and 1:10, which correspond to 250 nM of Aptazyme1.15-3’: 250, 500, 1250, and 2500 nM of Inhibitor1B, respectively). In this case, the signal in the absence of thrombin was subtracted from the signal in the presence of thrombin. In both graphs, the error bars represent the standard deviation of three repetitions. The description of the fluorescence normalization process can be found in “Materials and methods” section