
Fig. 1. shRNA screen identified EZH2 as an epigenetic regulator of human iCM reprogramming.
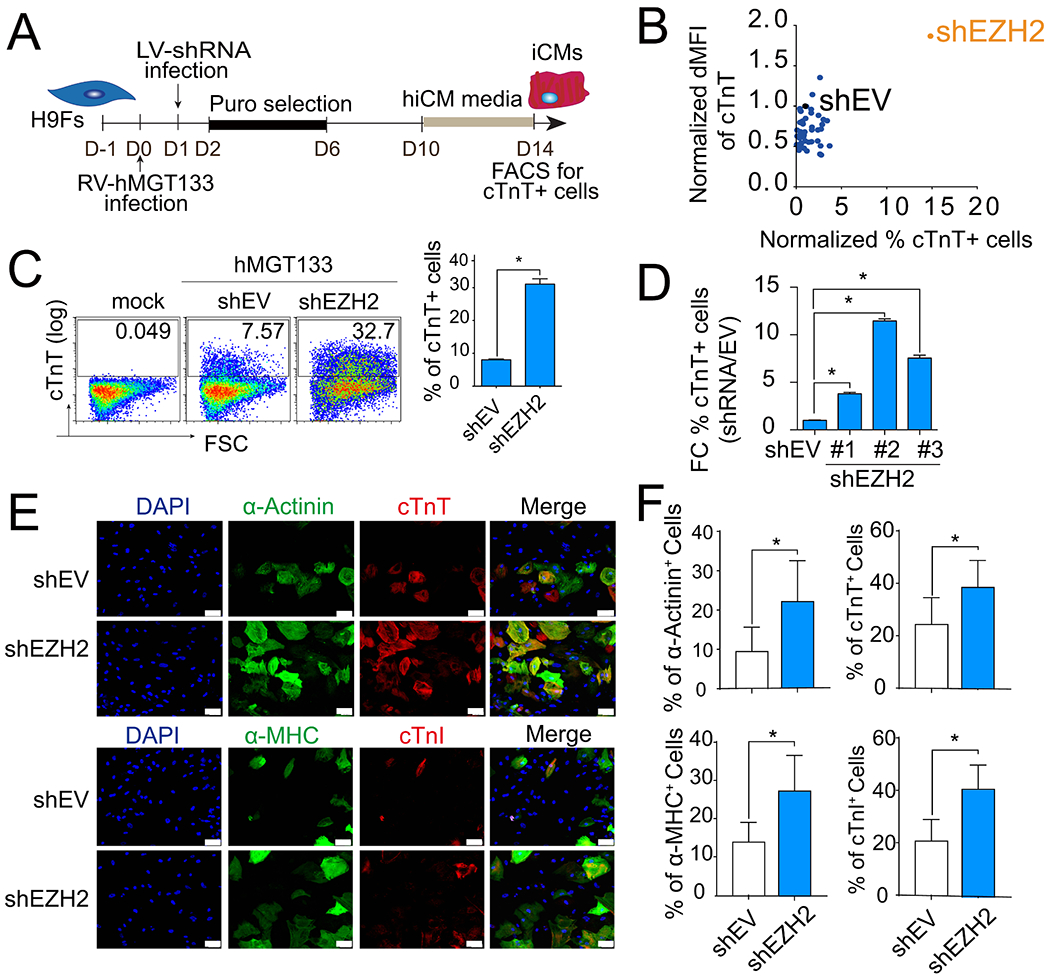
(A) Schematic of the shRNA-mediated loss of function screen. (B) FACS analysis of percentage and florescence intensity of cTnT + cells in hiCMs following RNAi screen. dMFI, delta median florescence intensity; shEV, empty vector control. (C) Representative flow plots and quantification of cTnT+ cells on H9F 2 weeks after transduction as indicated. (D) Quantification of cTnT+ cells after reprogramming with individual shRNAs targeting EZH2. (E-F) Representative images (E) and quantification (F) of immunofluorescence staining of α-Actinin+, cTnT+, α-MHC+, and cTnI + cells on H9F 2 weeks after transduction as indicated. Scale bars, 100 μm. Error bars indicate mean ± SEM; *P < 0.05.