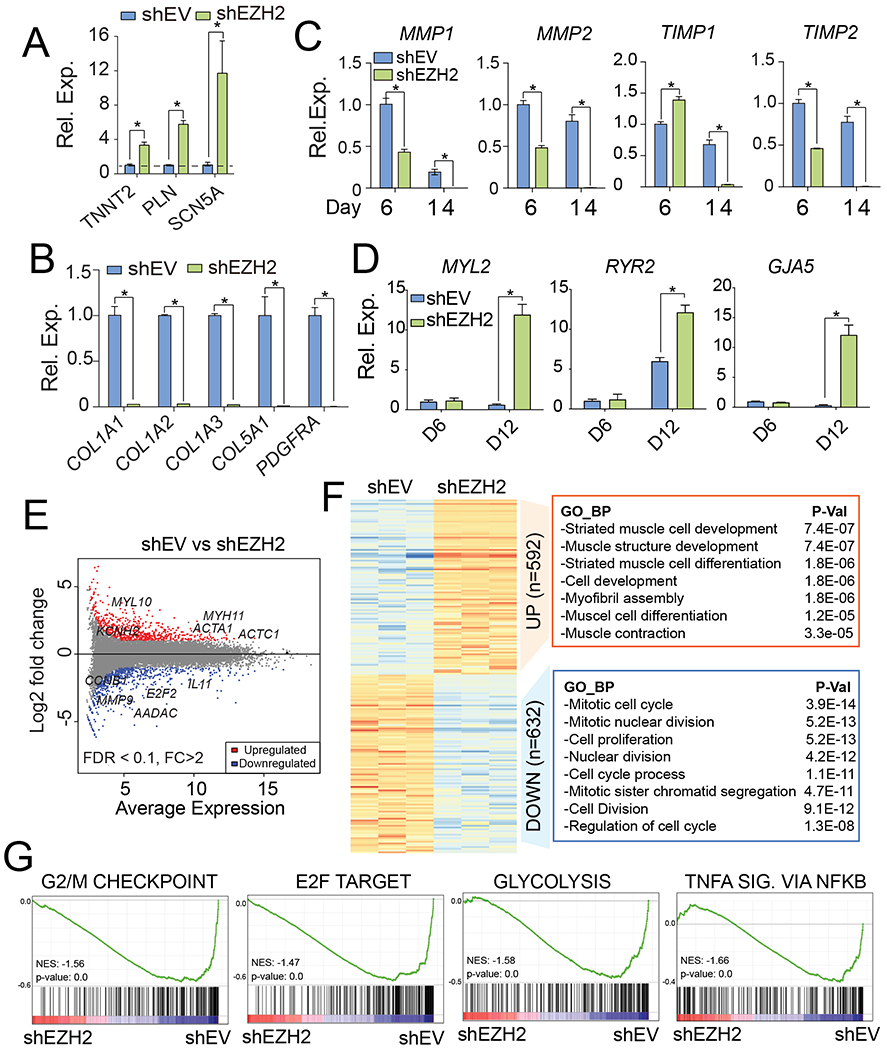
Fig. 2. Knockdown of EZH2 transcriptionally activated cardiac gene expression.

(A-B) Relative expression changes of cardiac (A) and fibroblast (B) genes in knockdown hiCMs. Dash line indicates normalized value 1 in shEV control cells. (C) Time course analysis for mRNA levels of ECM genes after EZH2 knockdown. (D) Time course analysis for mRNA levels of cardiac genes after EZH2 knockdown. (E) MA plot showing global transcriptomic changes in hiCMs upon EZH2 inhibition. Red and blue dots represent the significant up- or down-regulated DEGs (FDR < 0.1, FC > 2). (F) GO terms enriched in down- or up-regulated genes after EZH2 knockdown. (G) GSEA analysis showing the enriched gene sets in control cells versus EZH2 knockdown cells. NES, normalized enrichment score. SIG. stands for signaling. (For interpretation of the references to colour in this figure legend, the reader is referred to the web version of this article.)
