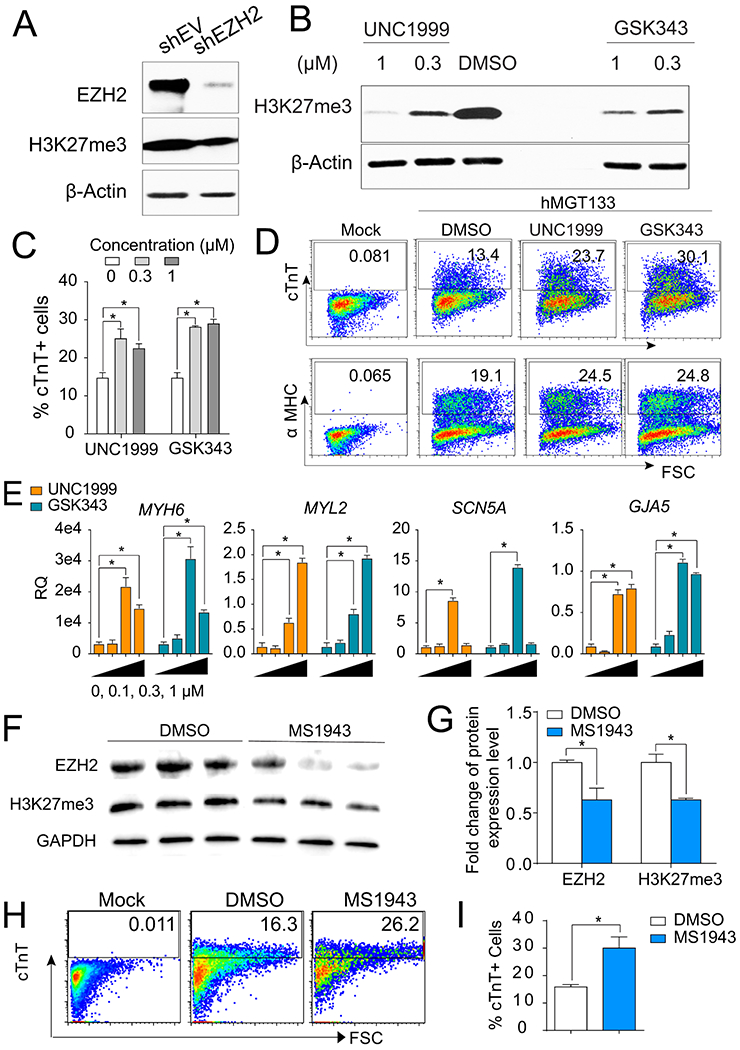
Fig. 3. Inhibition of global H3K27me3 using small molecules promoted hiCM generation.

(A) WB of EZH2 and H3K27me3 in reprogrammed cells after EZH2 knockdown. β-Actin serves as a loading control. (B) WB for H3K27me3 after 14 days reprogramming under treatment of DMSO or EZH2 inhibitors at different concentration as indicated. DMSO was used as a vehicle control. (C) Quantification of FACS analysis for cTnT+ hiCMs at 14 days under treatment of EZH2 inhibitors at different dosage as indicated. (D) Flow plots of cTnT+ or α-MHC+ cells in hMGT133-infected cells treated with 0.3 μM of indicated small molecules. (E) RT-qPCR analysis of mRNA levels for cardiac genes MYH6, MYL2, SCN5A, and GJA5 with treatment of EZH2 inhibitors at 0 μM, 0.1 μM, 0.3 μM and 1 μM. (F) WB of EZH2 and H3K27me3 in reprogrammed cells after applying EZH2 degrader (MS1943 at 4 μM). (G) Quantification of WB with treatment of DMSO (control) or MS1943 (EZH2 degrader). (H) Flow plots of cTnT+ cells in hMGT133-infected cells treated with DMSO or 4 μM of MS1943. (I) Quantification of FACS analysis for cTnT+ hiCMs at 14 days post-transduction with treatment of DMSO or MS1943. Error bars indicate mean ± SEM; *P < 0.05; ns, not significant.
