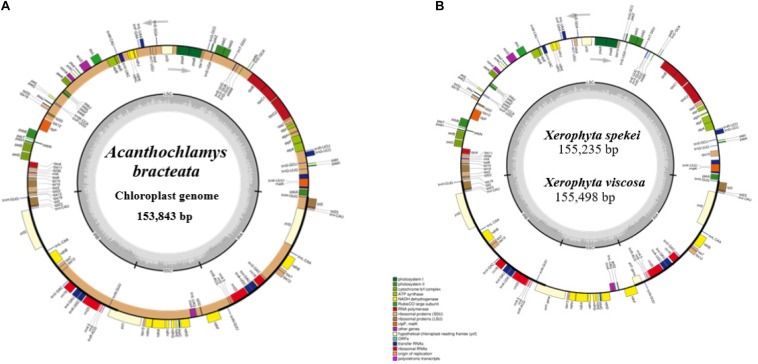
FIGURE 1.
Genome of map of: (A) Acanthochlamys bracteata; (B) Xerophyta spekei, and Xerophyta viscosa. The genes shown inside and outside the circular maps are transcribed clockwise and anticlockwise directions, respectively. Genes from different functional groups are shown in different colors. The thick dark lines show the extent of the Inverted repeats (IRa and IRb) separating the Large Single-Copy (LSC) and the Small Single-Copy (SSC) regions. The dark gray and the light gray lies embedded inside the circle represent the GC and the AT content, respectively.

