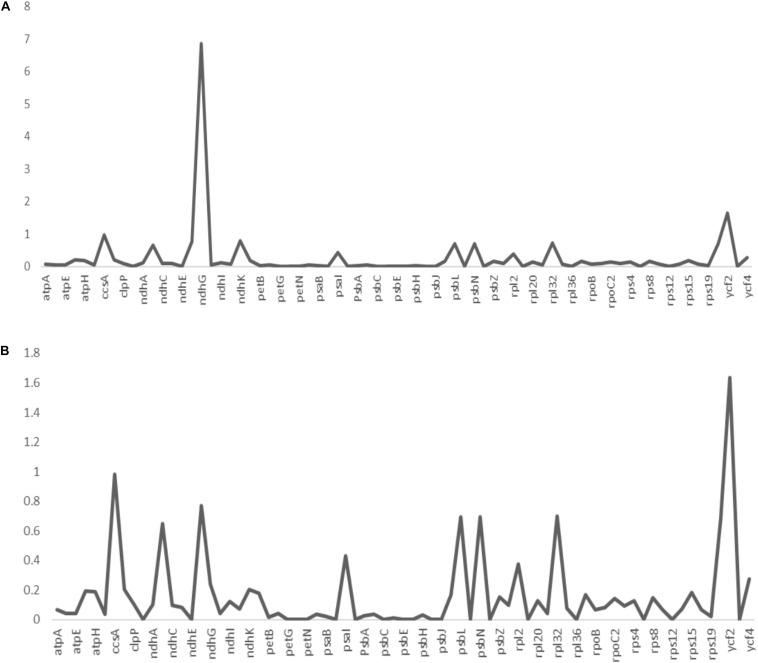
FIGURE 6.
The non-synonymous-to-synonymous substitution (Ka/Ks) ratios of 73 coding genes of (A) Acanthochlamys bracteata plastome relative to Xerophyta viscosa and (B) Acanthochlamys bracteata plastome relative to Xerophyta spekei. Note: Y- axis represents the Ka/Ks values (ratios) while the X- axis represents the protein-coding genes within the chloroplast genomes.

