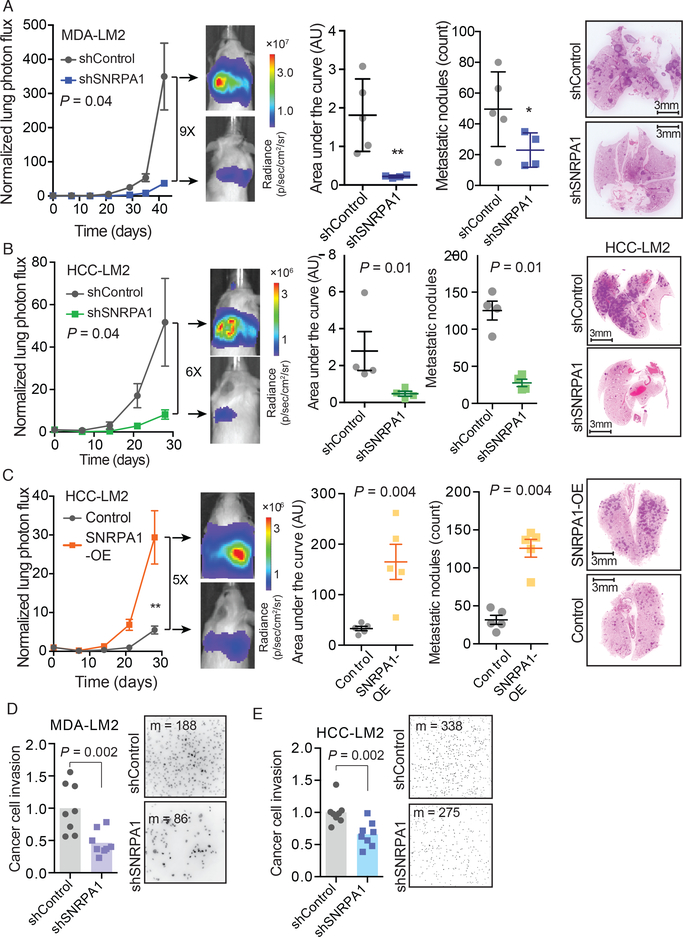
Fig. 3. SNRPA1 promotes in vivo metastatic colonization and invasion.
(A) MDA-LM2 cells stably expressing an shRNA targeting SNRPA1 or a control shRNA were injected via tail vein into NSG mice. Bioluminescence was measured at the indicated times; area under the curve was measured at the final time point. Lungs were stained with H&E and nodules were counted. n = 4–5 mice per cohort. (B) HCC1806-LM2 cells stably expressing an shRNA targeting SNRPA1 or a control shRNA were injected via tail vein into NSG mice. Bioluminescence was measured at the indicated times; area under the curve was measured at the final time point. Lungs were stained with H&E and nodules were counted. n = 4 mice per cohort. (C) HCC1806-LM2 cells stably overexpressing SNRPA1 or mCherry (control) were injected via tail vein into NSG mice. Bioluminescence was measured at the indicated times; area under the curve was measured at the final time point. n = 5 mice per cohort. Two-way ANOVA was used to compare in vivo bioluminescence measurements in (A-C). One-tailed Mann-Whitney U-test was used to compare AU and metastatic nodule count measurements in (A-C). (D) MDA-LM2 cells stably expressing an shRNA targeting SNRPA1 or a control shRNA were subjected to transwell invasion assays. n = 8 biological replicates. (E) HCC1806-LM2 cells stably expressing an shRNA targeting SNRPA1 or a control shRNA were subjected to transwell invasion assays. n = 8 biological replicates. Median numbers of cells per view (m) are shown. P-values calculated using one-tailed Mann-Whitney U-test (D-E).

