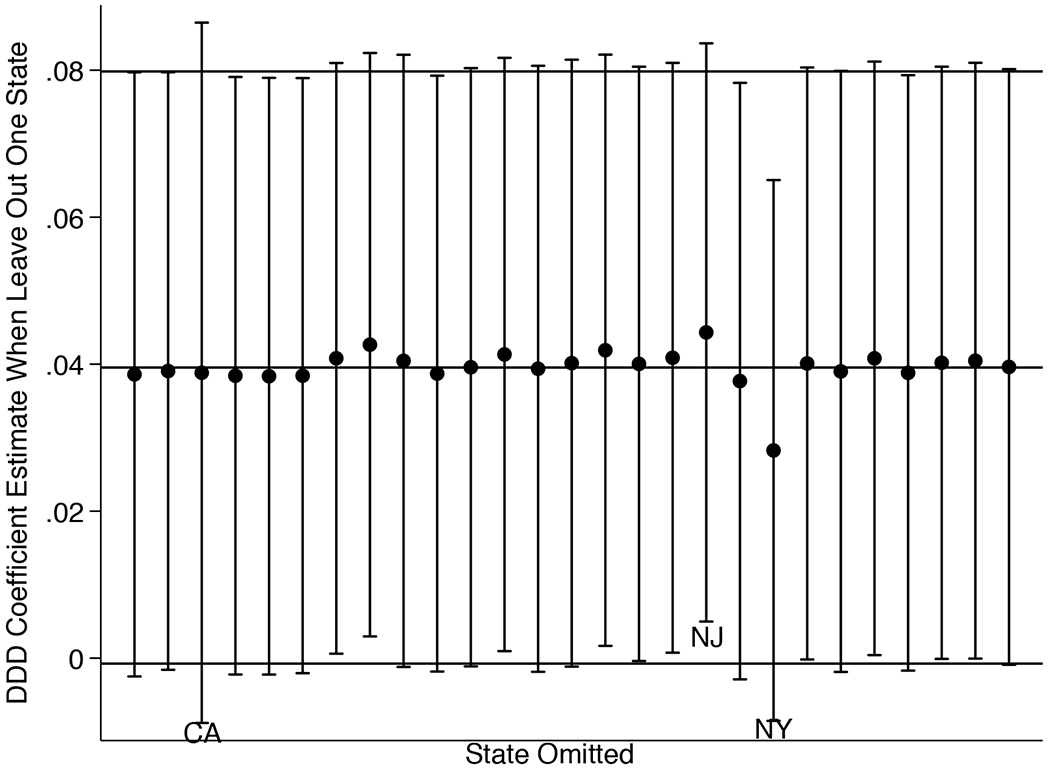
Appendix Figure 1B.

DDD Coefficient Estimates, Leaving Out One State.
Notes: The figures report the coefficient estimate and 95% confidence interval when we singly leave out each treatment state. In Figure 1A, we singly leave out each of the 32 states that expanded Medicaid between 2014 and 2017. The horizontal line at 0.018 represents our baseline DD estimate, and the horizontal lines at 0.006 and 0.0297 represent the 95% confidence interval around our baseline DD estimate. In Figure 1B, we singly leave out each of the 27 states that expanded Medicaid in the year 2014. The horizontal line at 0.040 represents our baseline DDD estimate, and the horizontal lines at −0.001 and 0.080 represent the 95% confidence interval.
