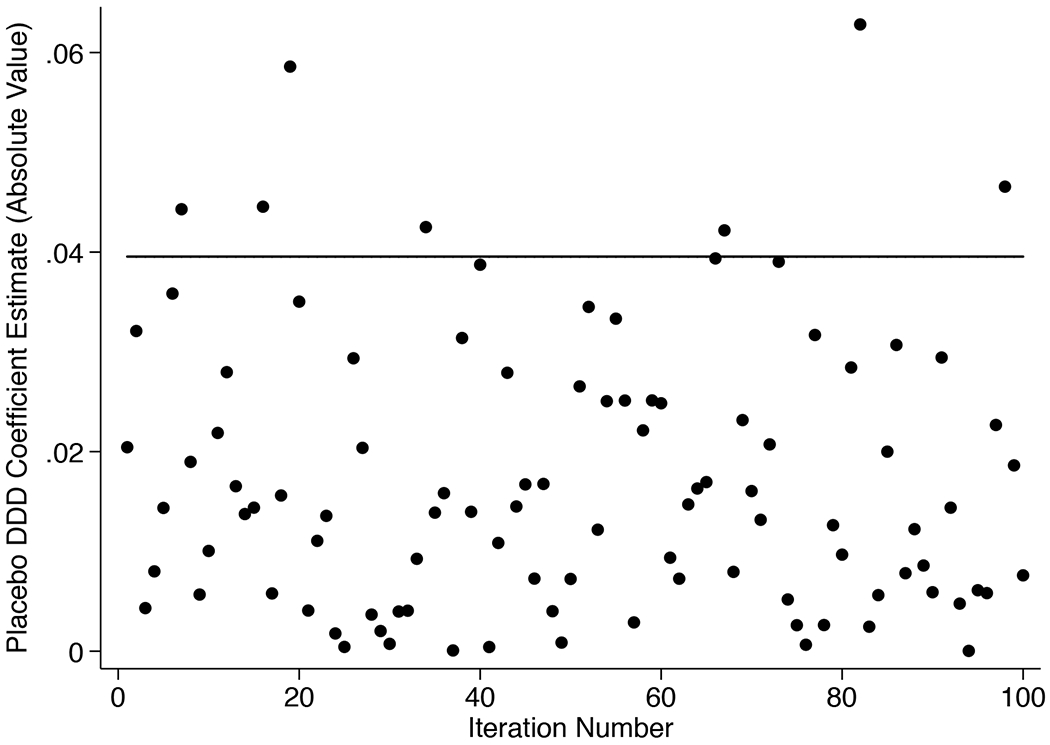
Appendix Figure 2B.

DDD Placebo Analysis Results.
Notes: The sample used to construct these estimates excludes states that adopted the ACA Medicaid expansions in 2015-17. Each point in these figures is the absolute value of a placebo estimate where we randomly select 27 states to be the treatment states (to reflect the 27 states that expanded Medicaid in 2014) and estimate the placebo coefficient on placebo treat x post 2014 (for Figure 2A) and placebo treat xpost 2015 x age 65 (for Figure 2B). We estimate 100 placebo regressions and the p-value from randomization inference is the fraction of times for which the absolute value of the placebo estimate exceeds the baseline estimate. In each figure, the horizontal line reflects the baseline estimate of 0.017 for the DD results (for the sample that excludes residents of states that adopted Medicaid in 2015-2017) and 0.040 for the DDD results. For the DD results, the p-value is 0.11, and for the DDD results, the p-value is 0.07.
