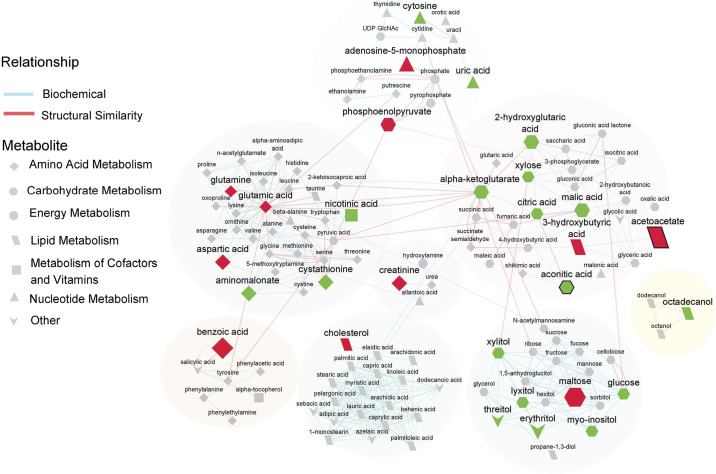
Figure 4.
Biochemical network displaying differences between high-dose GLP-1 + glucose (HDG) and control groups. Metabolites are connected based on biochemical relationships (orange, KEGG RPAIRS) or structural similarity (blue, Tanimoto coefficient ≥ 0.7). Metabolite size denotes fold change of area under the curves (AUCs) between HDG and control). Metabolite color represents the relative change [green, higher (P < 0.05); red, lower (P < 0.05); gray, no difference (P value ≥ 0.05)] in response to HDG vs. control. P values obtained from time 0 adjusted linear model analysis. Shapes display primary metabolic pathways and those metabolites with false discovery rate (FDR)-adjusted P value < 0.1 are highlighted with thick black borders. Clusters of metabolites are circled. HDG, n = 4 seal pups; control, n = 5 seal pups.

