
Figure 3.
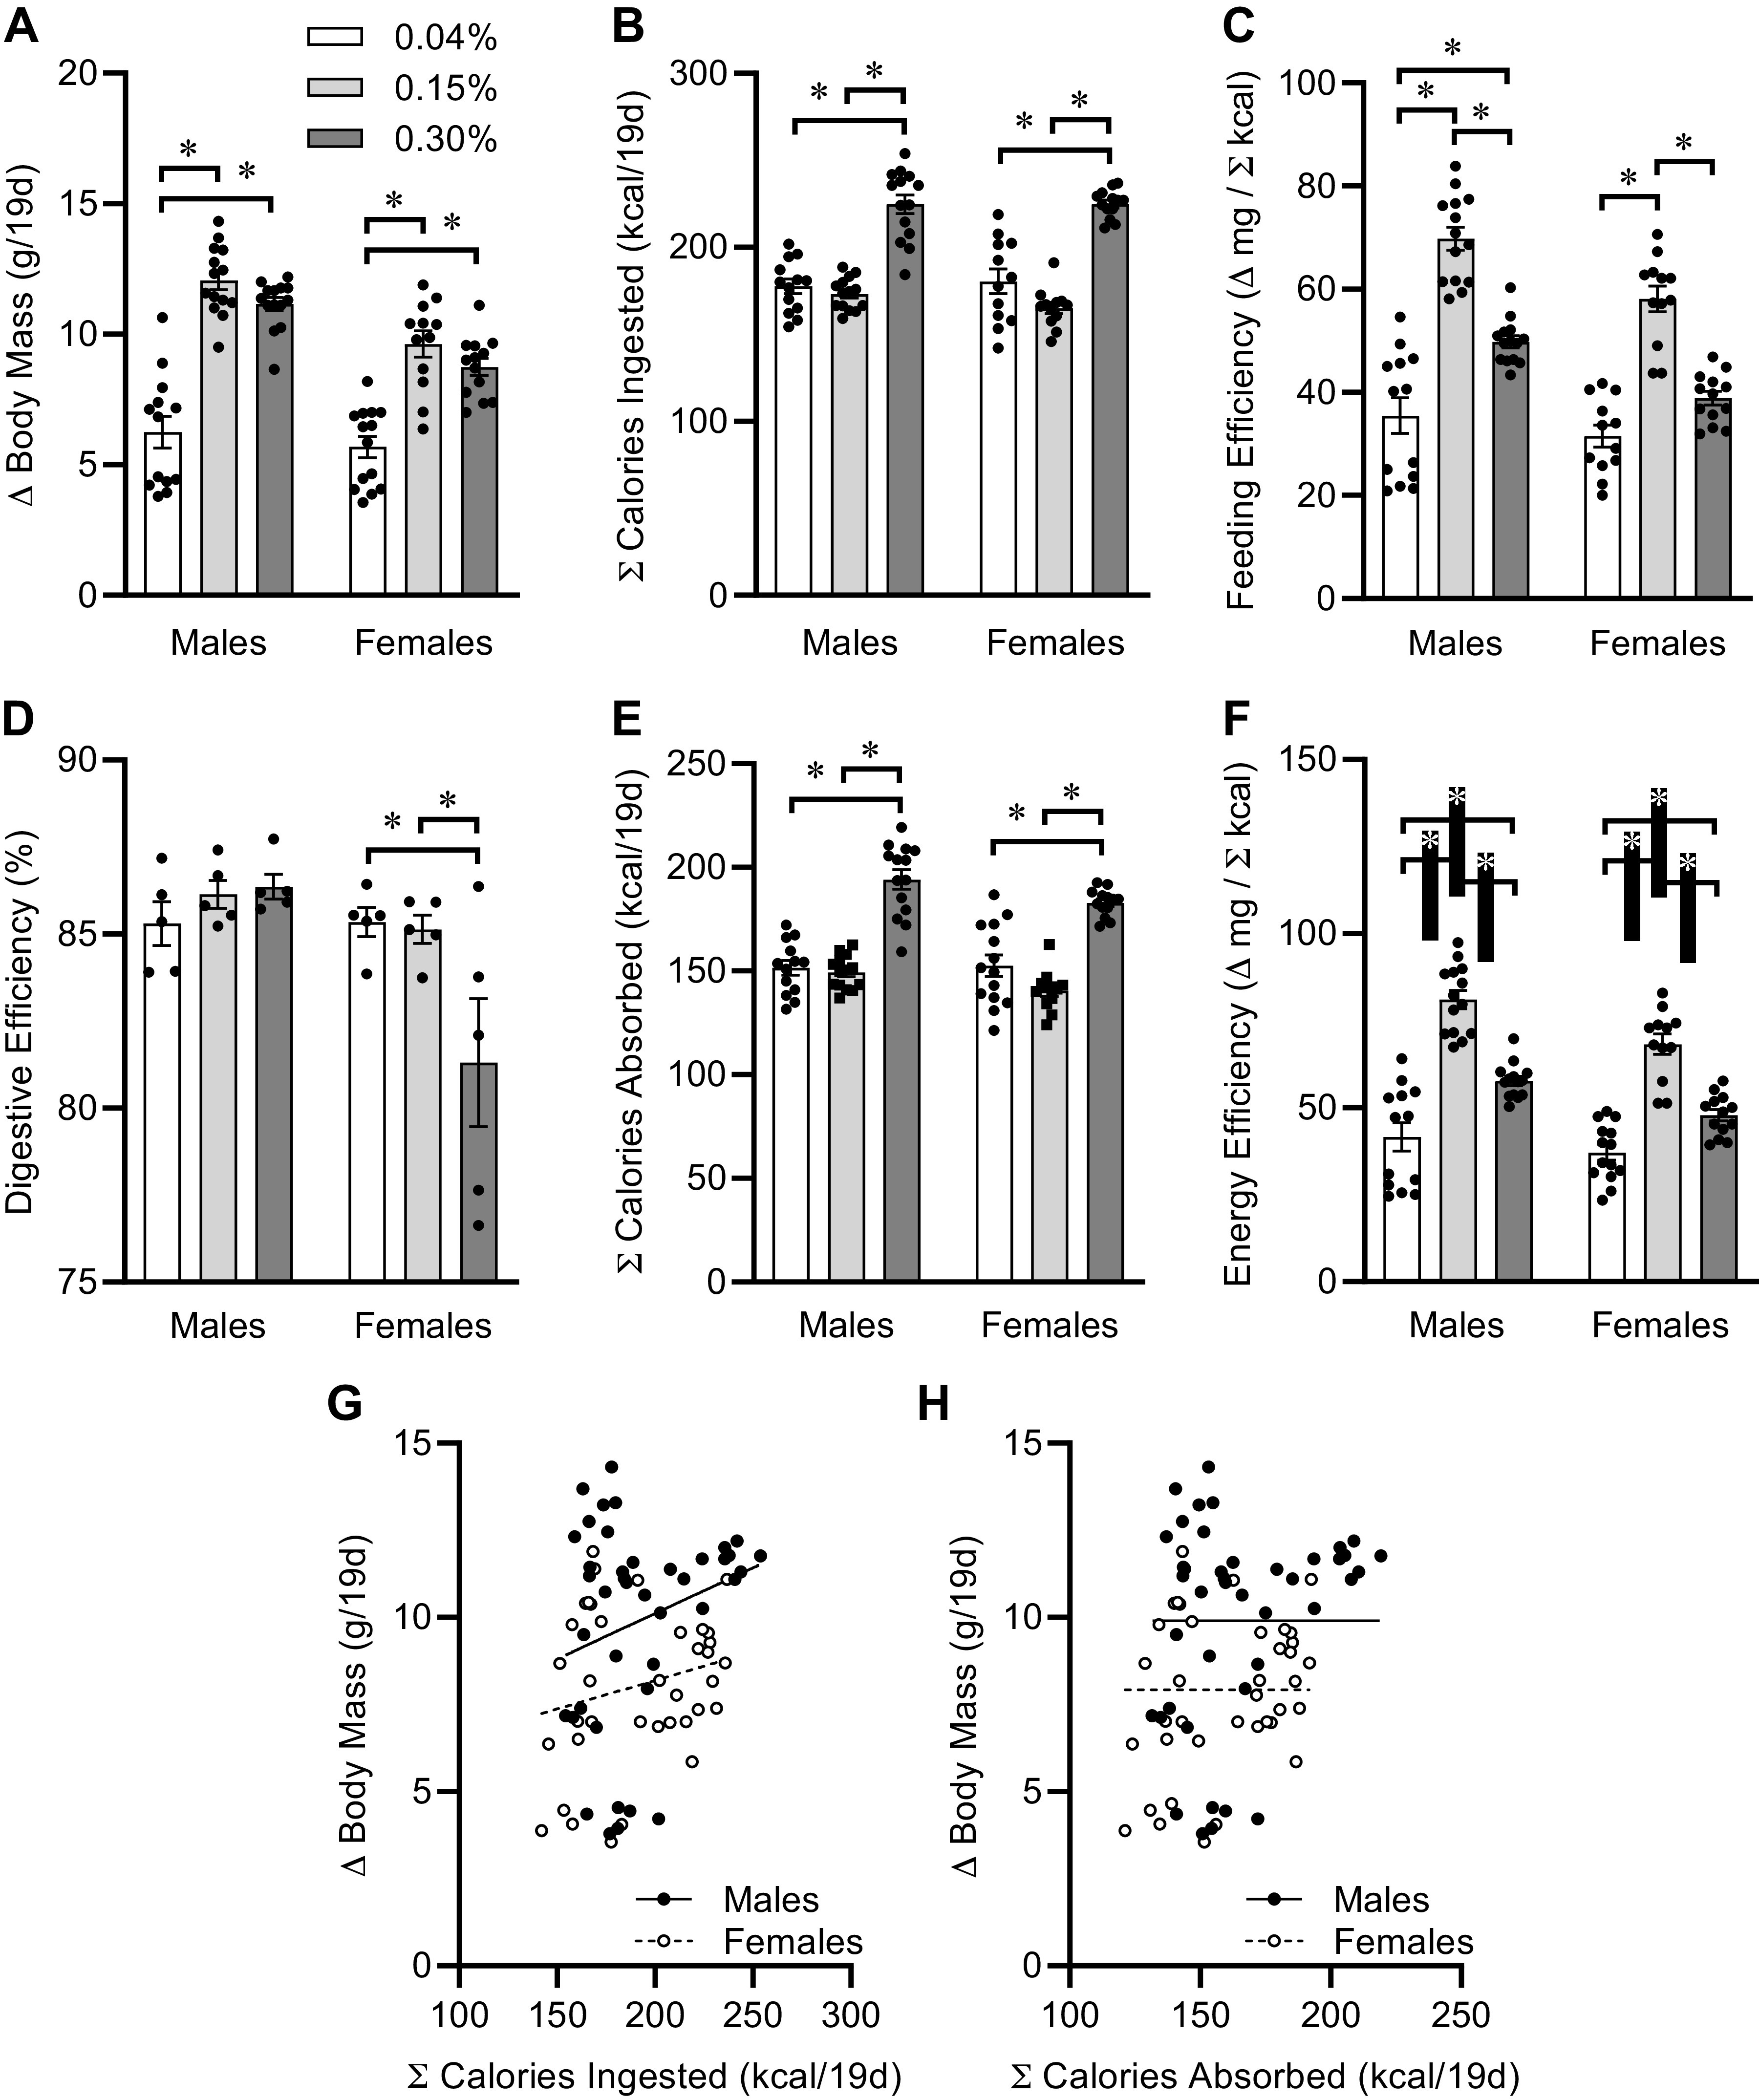
Contribution of caloric intake to postweaning growth. A: change in body masses from weaning at PD21 to PD40, of mice fed custom-modified 2920 diets containing 0.04%, 0.15%, or 0.30% Na. Diet P < 0.05, sex P < 0.05, diet × sex P < 0.05. B: total calories ingested PD21 to PD40. Diet P < 0.05, sex P = 0.63, diet × sex P = 0.43. C: feeding efficiency. Diet P < 0.05, sex P < 0.05, diet × sex P = 0.18. D: digestive efficiency determined on PD40 in a subset of animals. Diet P = 0.10, sex P < 0.05, diet × sex P < 0.05. E: estimate of total calories absorbed PD21 to PD40. Diet P < 0.05, sex P < 0.05, diet × sex P = 0.21. F: energy efficiency. Diet P < 0.05, sex P < 0.05, diet × sex P = 0.27. G: linear regression of change in body mass vs. total calories ingested, PD21 to PD40. Males R2 = 0.06, P = 0.12 vs. slope 0; females R2 = 0.05, P = 0.19 vs. slope 0. H: linear regression of change in body mass vs. total calories absorbed, PD21 to PD40. Males R2 = 0.07, P = 0.09 vs. slope 0; females R2 = 0.06, P = 0.14 vs. slope 0. For all panels, summary data presented as means ± SE, *P < 0.05 by Tukey’s multiple comparison procedure. Dots represent individual animals. For A–C and E–H, males: 0.04%, n = 13; 0.15%, n = 14; 0.30%, n = 14; and females: 0.04%, n = 12; 0.15%, n = 12; 0.30%, n = 13. For D, n = 5 for each group.