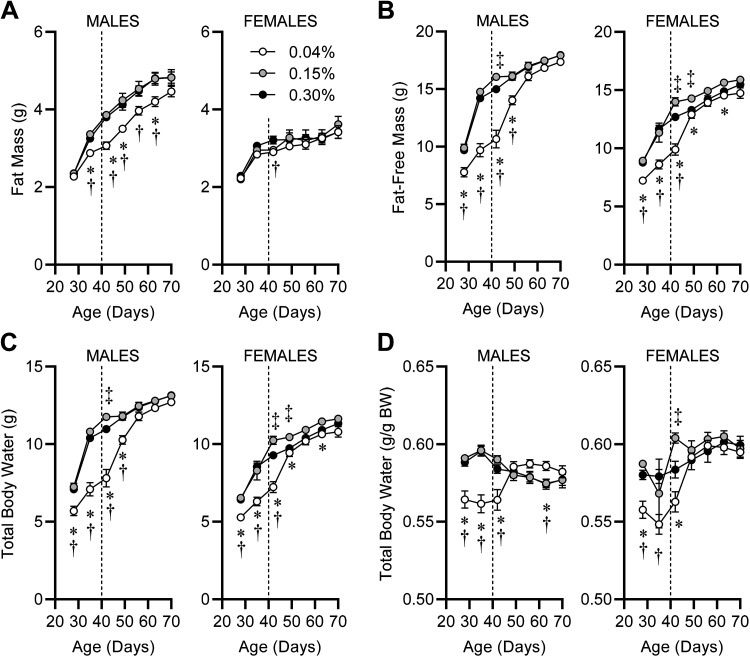
Figure 5.
Body composition during and following postwean dietary Na manipulation. A: fat masses from PD21 to PD70 of mice fed custom-modified 2920 diets containing 0.04%, 0.15%, or 0.30% Na. For males, diet P < 0.05, age P < 0.05, diet × age P < 0.05. For females, diet P = 0.41, age P < 0.05, diet × age P = 0.69. B: fat-free masses. For both sexes, diet P < 0.05, age P < 0.05, diet × age P < 0.05. C: total body water, estimated as 73.2% of fat-free mass. For both sexes, diet P < 0.05, age P < 0.05, diet × age P < 0.05. D: total body water normalized to total body mass. For males, diet P = 0.09, age P = 0.07, diet × age P < 0.05. For females, diet P = 0.05, age P < 0.05, diet × age P < 0.05. For all panels, *P < 0.05 for 0.04% vs. 0.15% Na diet; †P < 0.05 for 0.04% vs. 0.30% Na diet. ‡P < 0.05 for 0.15% vs. 0.30% Na diet by Tukey’s multiple comparison procedure. For all panels PD28–PD42, males: 0.04%, n = 13; 0.15%, n = 14; 0.30%, n = 14; and females: 0.04%, n = 14; 0.15%, n = 12; 0.30%, n = 13. For all panels PD49–PD70, n = 9 for all groups.

