
Figure 6.
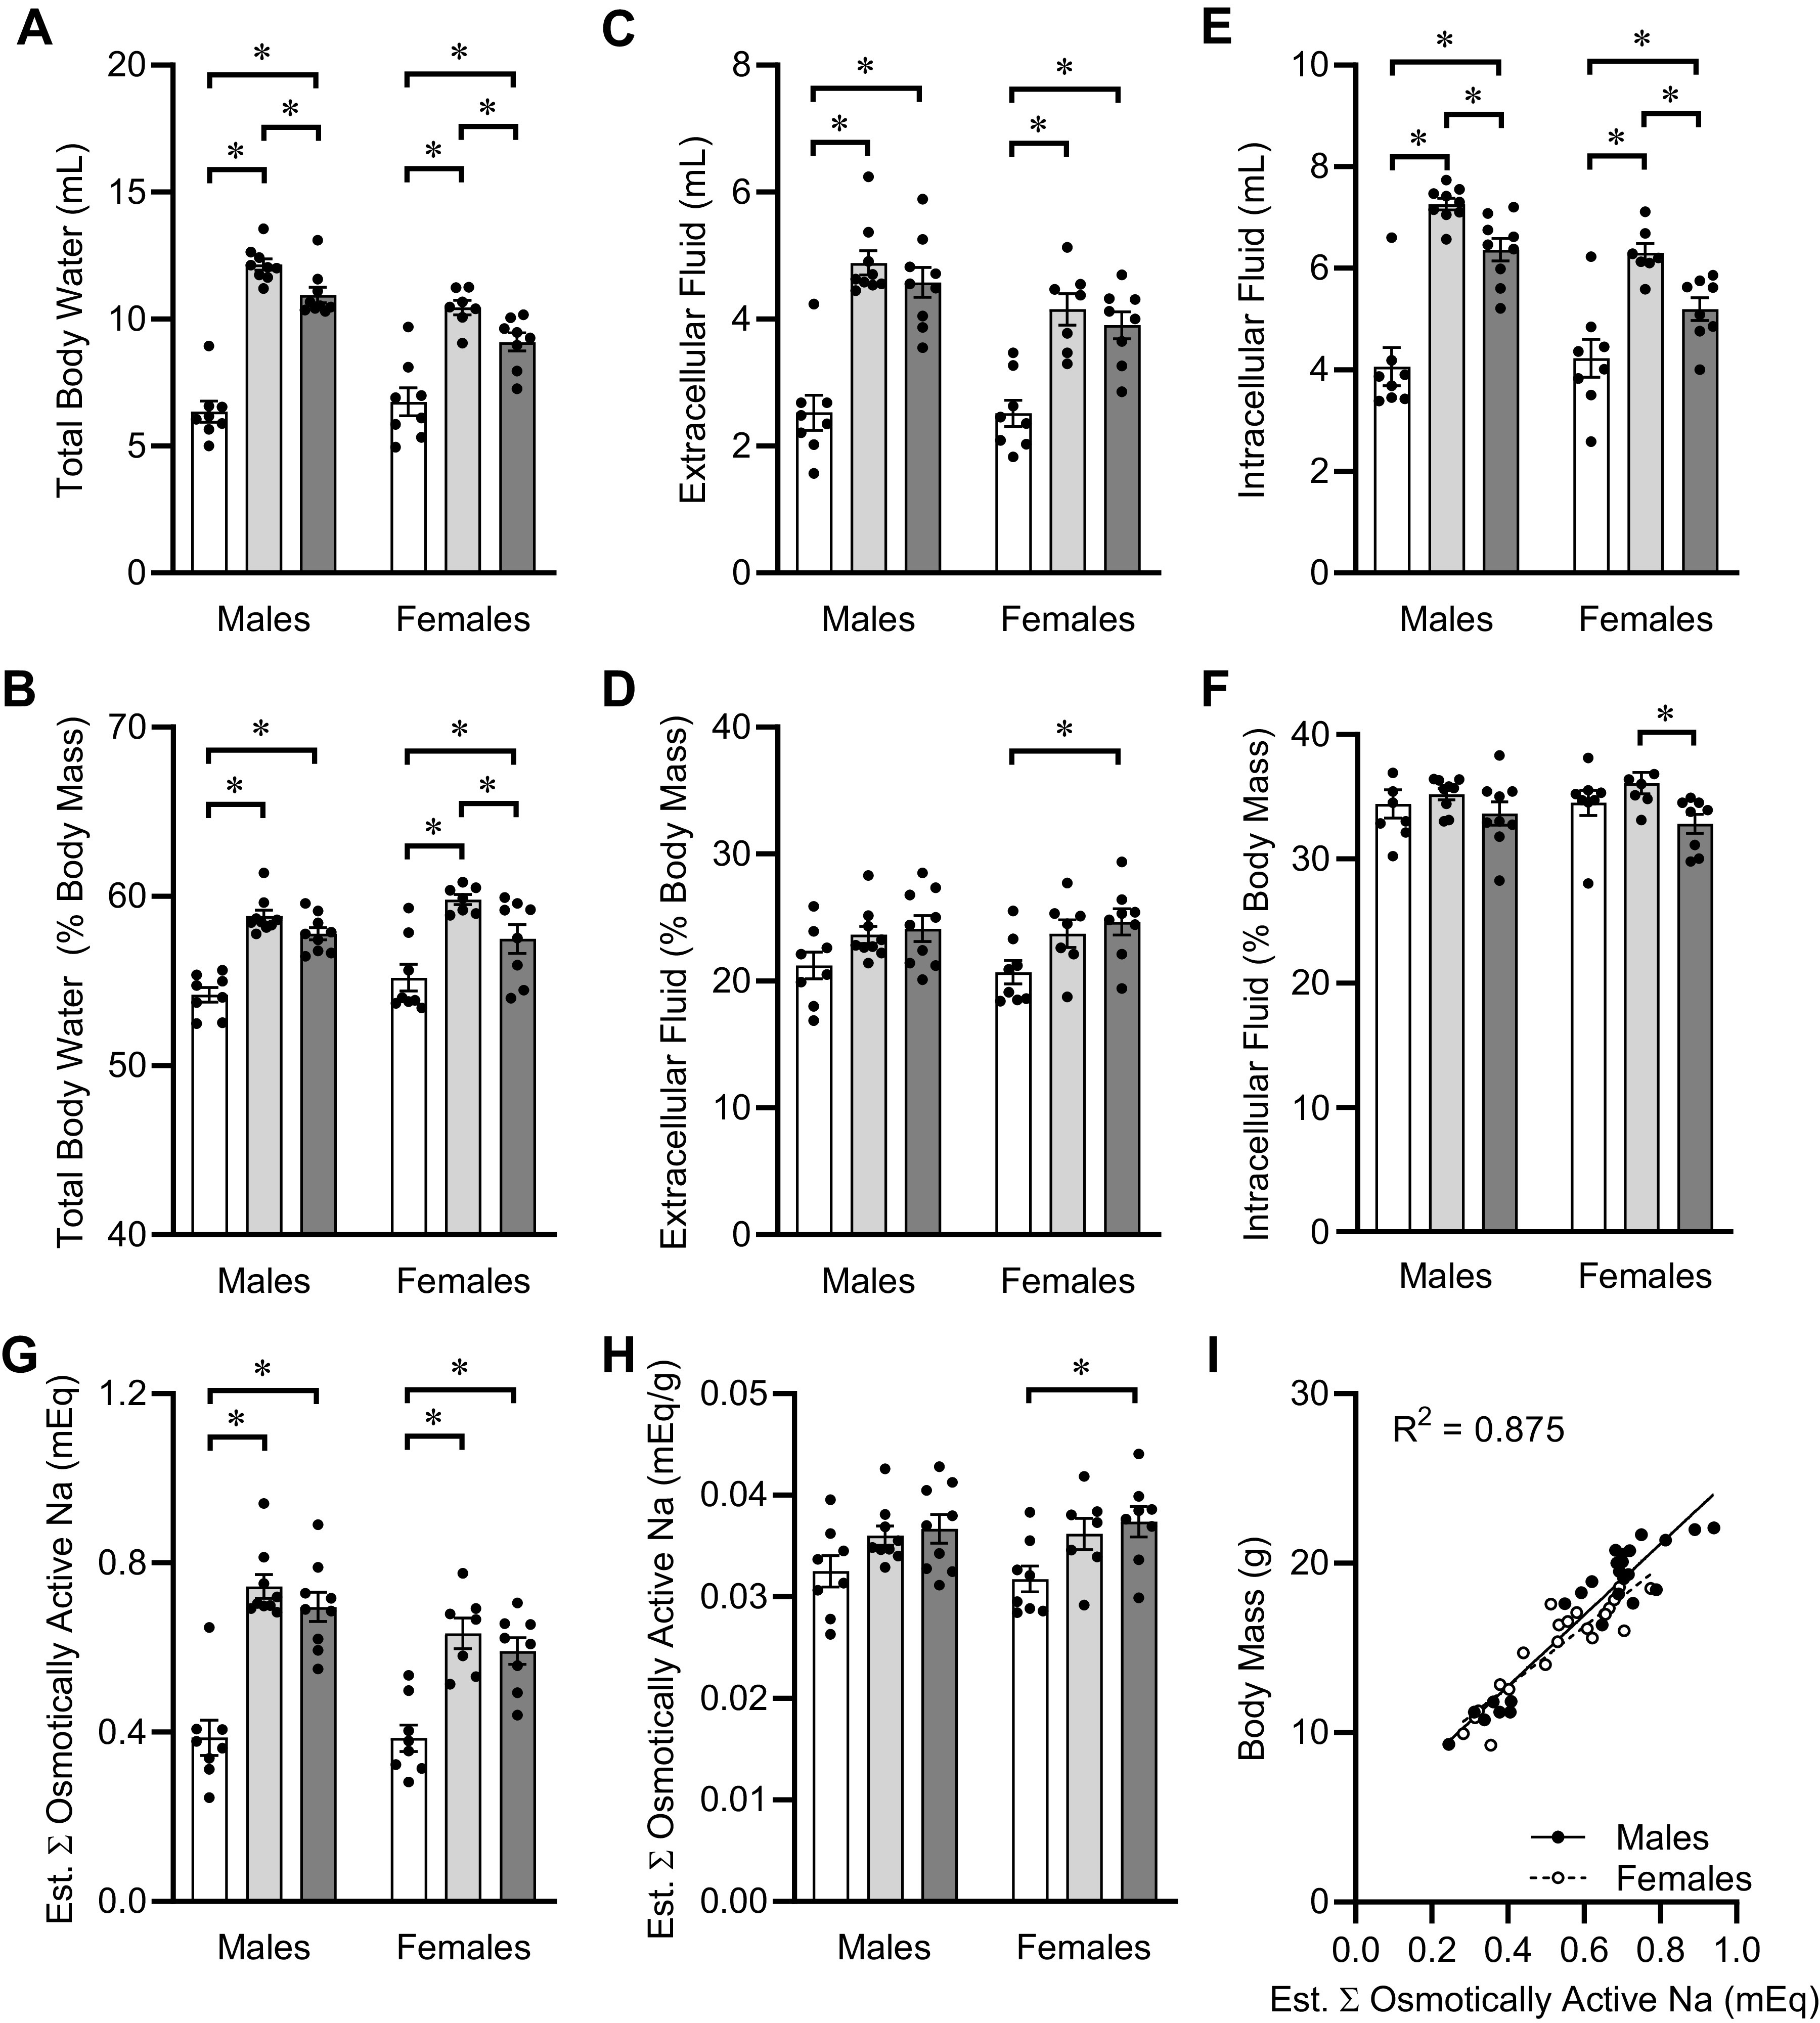
Fluid compartmentalization and total body Na content at PD40. A: total body water, estimated at 73.2% of fat-free mass by nuclear magnetic resonance (NMR). Diet P < 0.05, sex P < 0.05, diet × sex P < 0.05. B: total body water normalized to total body mass. Diet P < 0.05, sex P = 0.23, diet × sex P = 0.40. C: extracellular fluid, determined by bioimpedance spectroscopy (BIS). Diet P < 0.05, sex P < 0.05, diet × sex P = 0.24. D: extracellular fluid normalized to total body mass. Diet P < 0.05, sex P = 0.98, diet × sex P = 0.86. E: intracellular fluid, determined by BIS. Diet P < 0.05, sex P < 0.05, diet × sex P < 0.05. F: intracellular fluid normalized to total body mass. Diet P < 0.05, sex P = 0.94, diet × sex P = 0.61. G: estimated total osmotically active Na, assuming extracellular fluid at 145 mmol/L Na and intracellular fluid at 5 mmol/L Na. Diet P < 0.05, sex P < 0.05, diet × sex P = 0.21. H: osmotically active Na normalized to total body mass. Diet P < 0.05, sex P = 0.97, diet × sex P = 0.86. I: linear regression of total body mass vs. total osmotically active Na at PD40. Males R2 = 0.89, slope 20.98 ± 1.48 P < 0.05, vs. females R2 = 0.82, slope 17.66 ± 1.83 P < 0.05; comparison of slopes P = 0.18. For all panels, males: 0.04%, n = 8; 0.15%, n = 9; 0.30%, n = 9; and females: 0.04%, n = 8; 0.15%, n = 7; 0.30%, n = 8. *P < 0.05 by Tukey's multiple comparisons procedure.