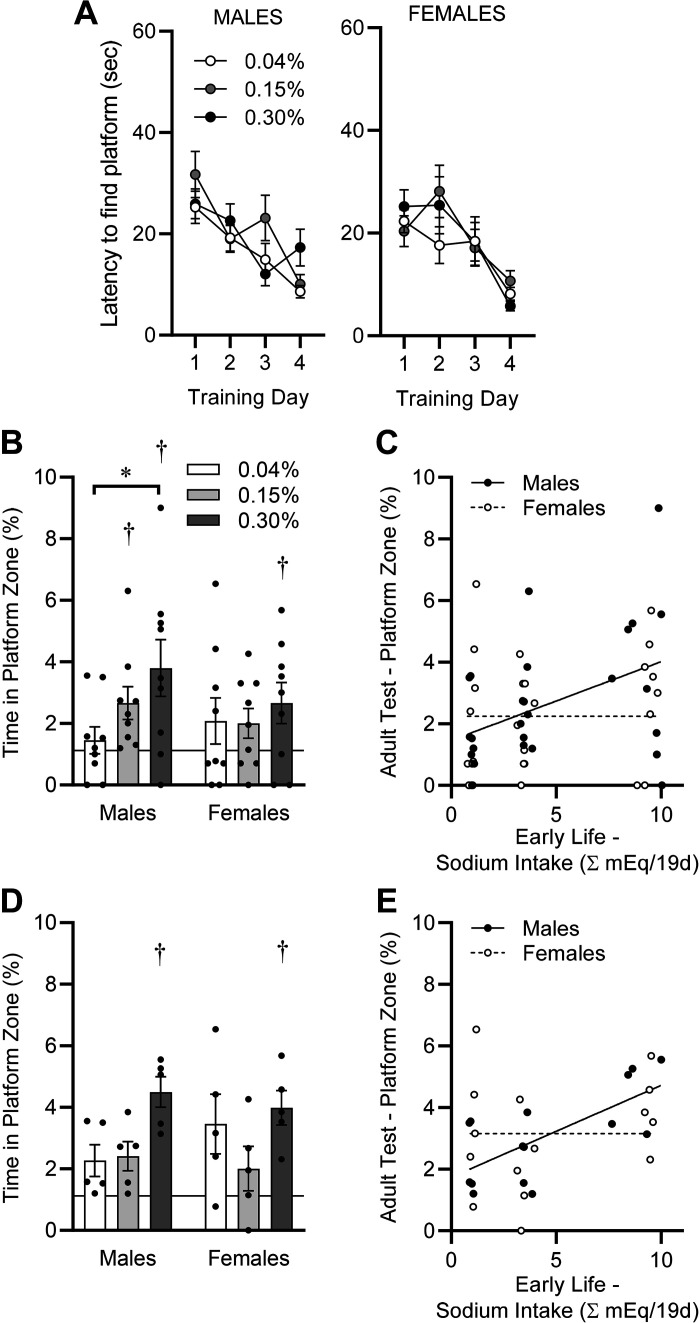
Figure 7.
Spatial learning and memory, assessed by Morris water maze paradigm, in adulthood (PD65–PD69). A: latency to find platform on training days. Platform was visible on training day 1 and submerged on subsequent training days. Males: diet P = 0.34, day P < 0.05, diet × day P = 0.05; females: diet P = 0.70, day P < 0.05, diet × day P = 0.36. B: time spent within area previously occupied by submerged platform during 30-s probe trial, performed 24 h after final training day. Horizontal line at 1.12% represents chance performance. Diet P = 0.09, sex P = 0.47, diet × sex P = 0.39. C: simple linear regression comparing probe trial performance on PD69 vs. integrated Na intake between PD21 and PD40. Males R2 = 0.18, and P = 0.03 vs. a slope of zero. Females R2 = 0.03 and P = 0.40 vs. a slope of zero. D: reanalysis of data from B, excluding animals that were exposed to isoflurane on PD40. Diet P = 0.01, sex P = 0.86, diet × sex P = 0.36. E: reanalysis of data from C, excluding animals that were exposed to isoflurane on PD40. Males R2 = 0.48 and P < 0.01 vs. a slope of zero. Females R2 = 0.06 and P = 0.39 vs. a slope of zero. For all panels, *P < 0.05 by Tukey’s multiple comparisons procedure, and †P < 0.05 vs. chance performance (1.12%) by one-sample t test. For A–C, n = 9 for all groups; for D and E, n = 5 for all groups.

