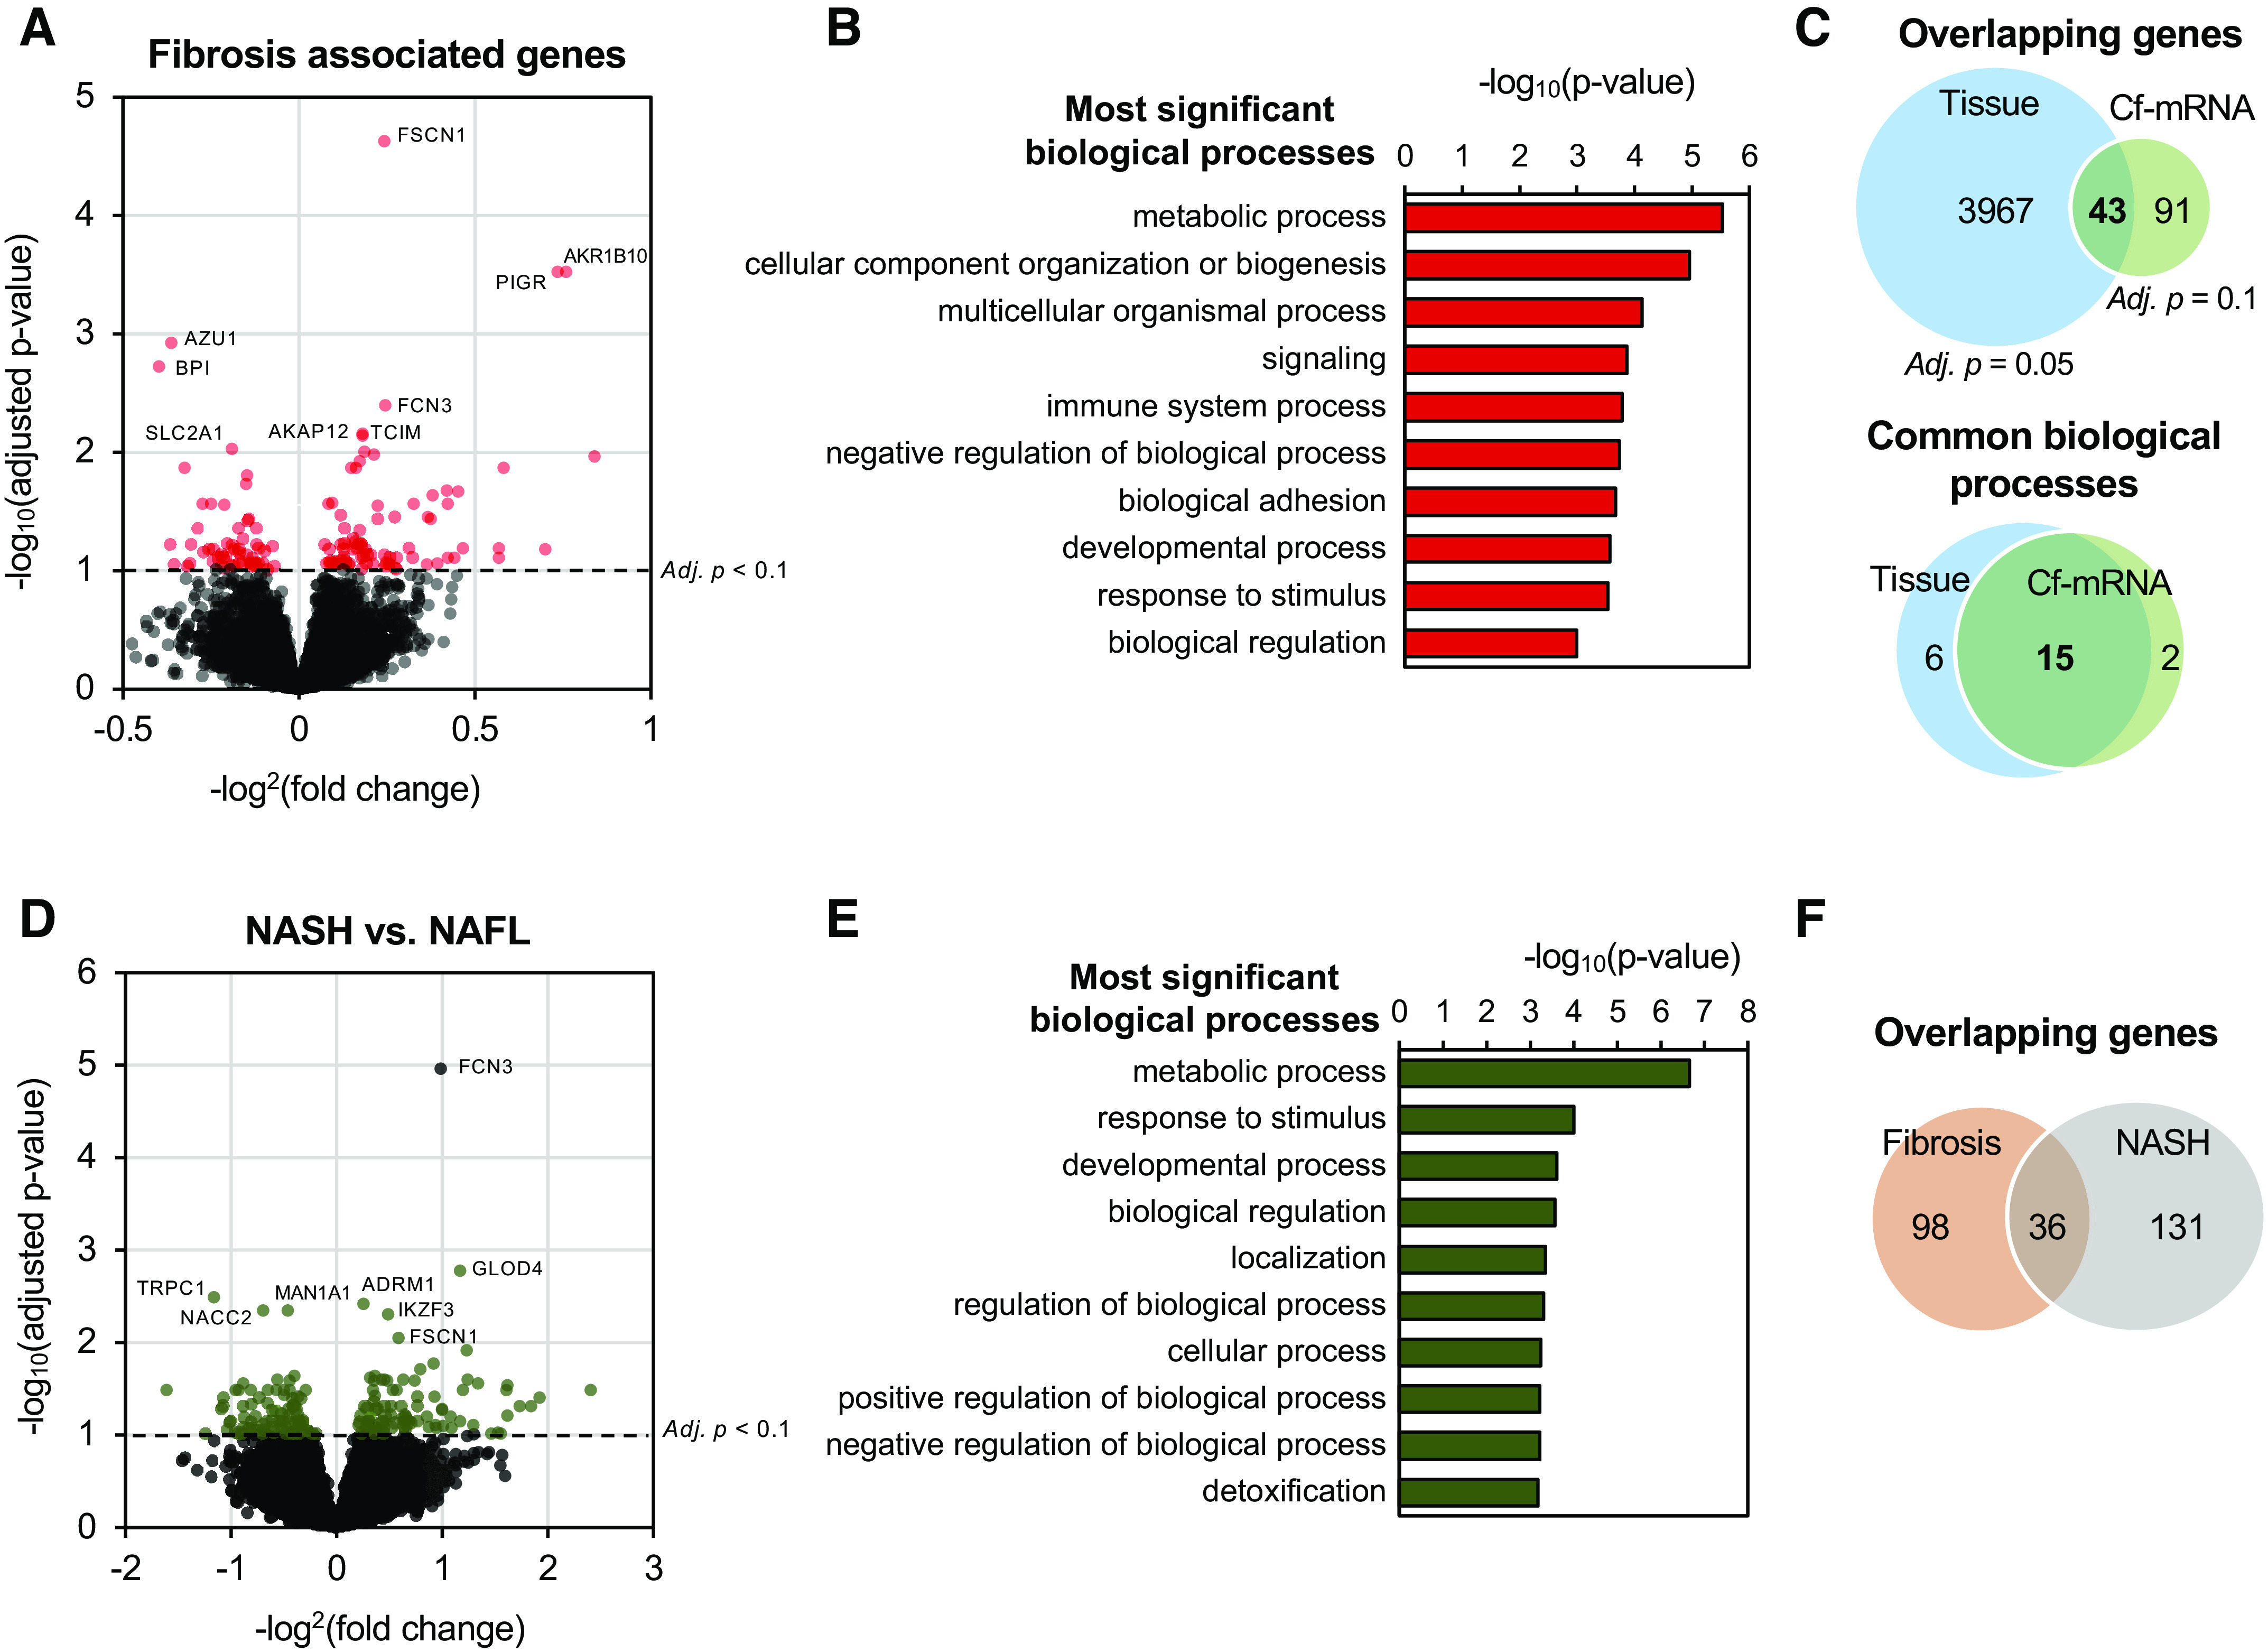
Figure 4.

Cell-free (cf)-mRNA profiling reveals key biological pathways and processes associated with advanced fibrosis. A: volcano plot depicting the differential expression analysis associated with fibrosis in cf-mRNA (n = 176). Significantly dysregulated genes are denoted in red, false discovery rate (FDR) < 0.10 was used as the cutoff criterion. B: most significantly enriched pathways identified using genes significantly dysregulated with fibrosis stages (Gene Ontology). C: overlap of genes (top) and pathways (bottom) between tissue and cf-mRNA fibrosis stage-associated genes [tissue data obtained from Hoang et al. (34)]. Pathway analysis was conducted using Gene Ontology (biological processes). D: volcano plot depicting the differential expression analysis between nonalcoholic steatohepatitis (NASH) and NAFL in cf-mRNA (132 NASH vs. 44 NAFL). Significantly dysregulated genes are denoted in green, FDR < 0.10 was used as the cutoff criterion. E: most significantly enriched pathways identified using genes significantly dysregulated between NASH and NAFLD (Gene Ontology). F: overlap of differentially dysregulated genes between fibrosis and NASH vs. NAFLD comparison.
