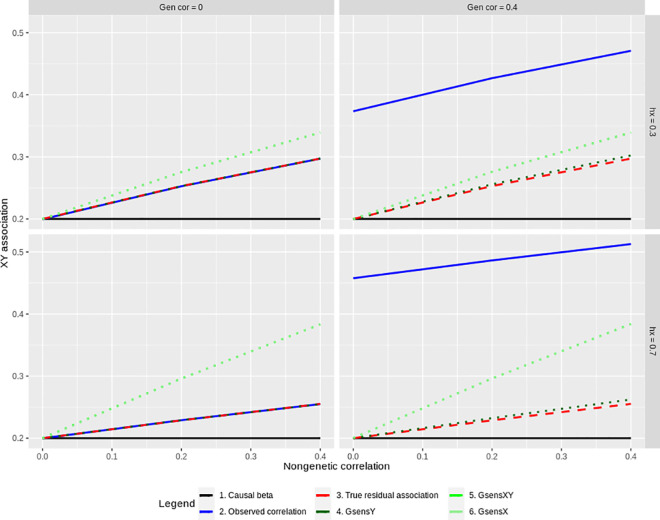
Fig 2. Collider bias: simulation results.
The standardized association between X and Y (Y-axis) is plotted as a function of the correlation between the non-genetic factors for X and Y that generates non-genetic confounding (X-axis). The figure is faceted left to right according to the genetic correlation between direct effects that generates genetic confounding (gen cor), and top to bottom according to the heritability of X (hx). A subset of results is plotted with causal effect = 0.20, N = 10,000, heritability of Y = 70% and the full set of results is provided in S1 Data. Note that estimates from GsensX and GsensXY are very similar in this first set of simulations but can differ in the second when polygenic scores are set to capture varying levels of the heritability of X and Y.

