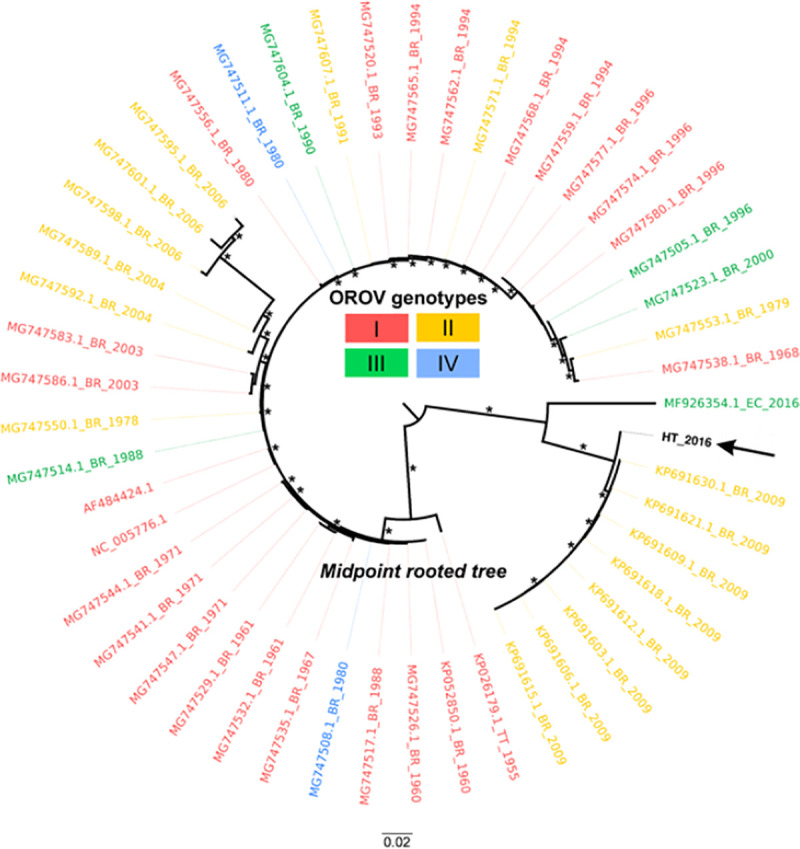
Fig 9. Maximum likelihood (ML) midpoint rooted tree based on 49 representative Large segment sequences (6830 sites) of OROV strains.

Tips are colored according to genotype. OROV human isolate from this study (GenBank no. MN264267) is represented by the arrow and bolded name. Tip labels represents GenBank accession code, country of origin (BR, Brazil; PE, Peru; EC, Ecuador; HT, Haiti; TT, Trinidad and Tobago), and year of isolation. Asterisks assumes SH-aLTR/aBayes/ultrafast bootstrap support values. Only values equal or greater than 75% are shown. Branch lengths are drawn in scale of nucleotide substitutions per site according to the bar in the figure.
