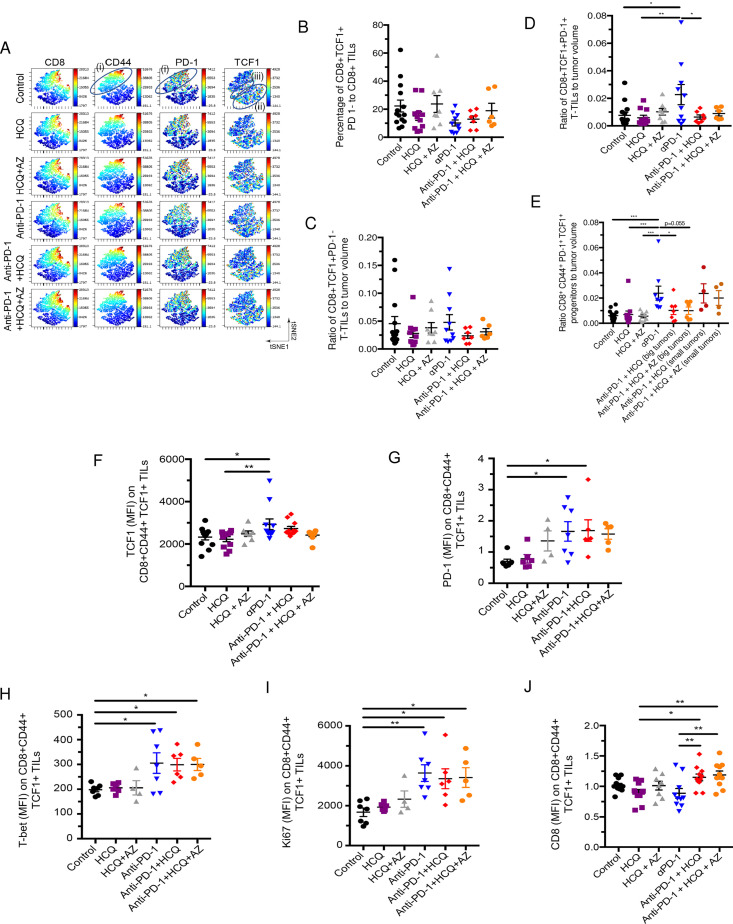
Fig 3. The effect of HCQ and AZ on the presence of CD8+TCF1+ progenitor TILs.
Mice were implanted with B16 tumours as described in Fig 1. Panel A: viSNE profiles of total CD8+ TILs. The figure shows the presence of the upper cluster of TILs expressing moderate to high levels of CD8, PD-1 and CD44 (island (i)), a second island (ii) expressing moderate levels of TCF-1+ with no PD-1; and island (iii) that co-expresses PD-1+ and TCF-1+. Panel B: Percentage of CD8+ TCF-1+ PD-1- TILs as a percent of total CD8+ TILs. Panel C: Ratio of CD8+ CD44+TCF-1+ PD-1- TILs relative to tumor volume. Panel D: Ratio of CD8+ TCF-1+ PD-1+ TILs relative to tumor volume. Panel E: Ratio of CD8+ CD44+ PD-1+TCF-1+ progenitor TILs relative to tumor volume. A comparison of tumor volumes in mice where HCQ blocked the response to anti-PD-1 (big tumors) and mice where HCQ failed to block the response to anti-PD-1 (small tumors). Panel F: MFI of TCF-1 expression CD8+ CD44+TCF-1+ PD-1+ TILs in response to anti-PD-1 alone or in combination with HCQ or HCQ/AZ. Panel G: MFI of PD-1 expression CD8+ CD44+TCF-1+ PD-1+ TILs in response to anti-PD-1 alone or in combination with HCQ or HCQ/AZ. Panel H: MFI of T-bet expression CD8+ CD44+TCF-1+ PD-1+ TILs in response to anti-PD-1 alone or in combination with HCQ or HCQ/AZ. Panel I: MFI of Ki67 expression CD8+ CD44+TCF-1+ PD-1+ TILs in response to anti-PD-1 alone or in combination with HCQ or HCQ/AZ. Panel J: MFI of CD8 expression CD8+ CD44+TCF-1+ PD-1+ TILs in response to anti-PD-1 alone or in combination with HCQ or HCQ/AZ.

