Figure 2.

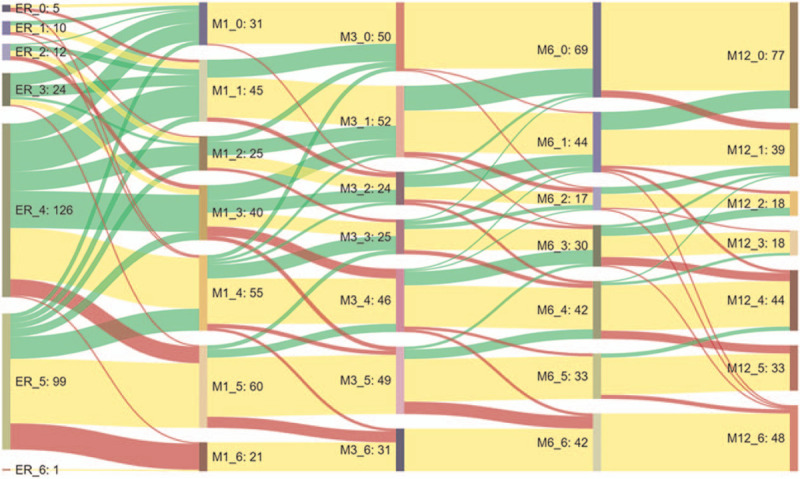
Sankey diagram for the visualization of temporal patterns for AIS patient and its mRS change over time. Yellow, green, and red colors were used to distinguish patient's neurological recovery: improved, remained, and worse, respectively.

Sankey diagram for the visualization of temporal patterns for AIS patient and its mRS change over time. Yellow, green, and red colors were used to distinguish patient's neurological recovery: improved, remained, and worse, respectively.