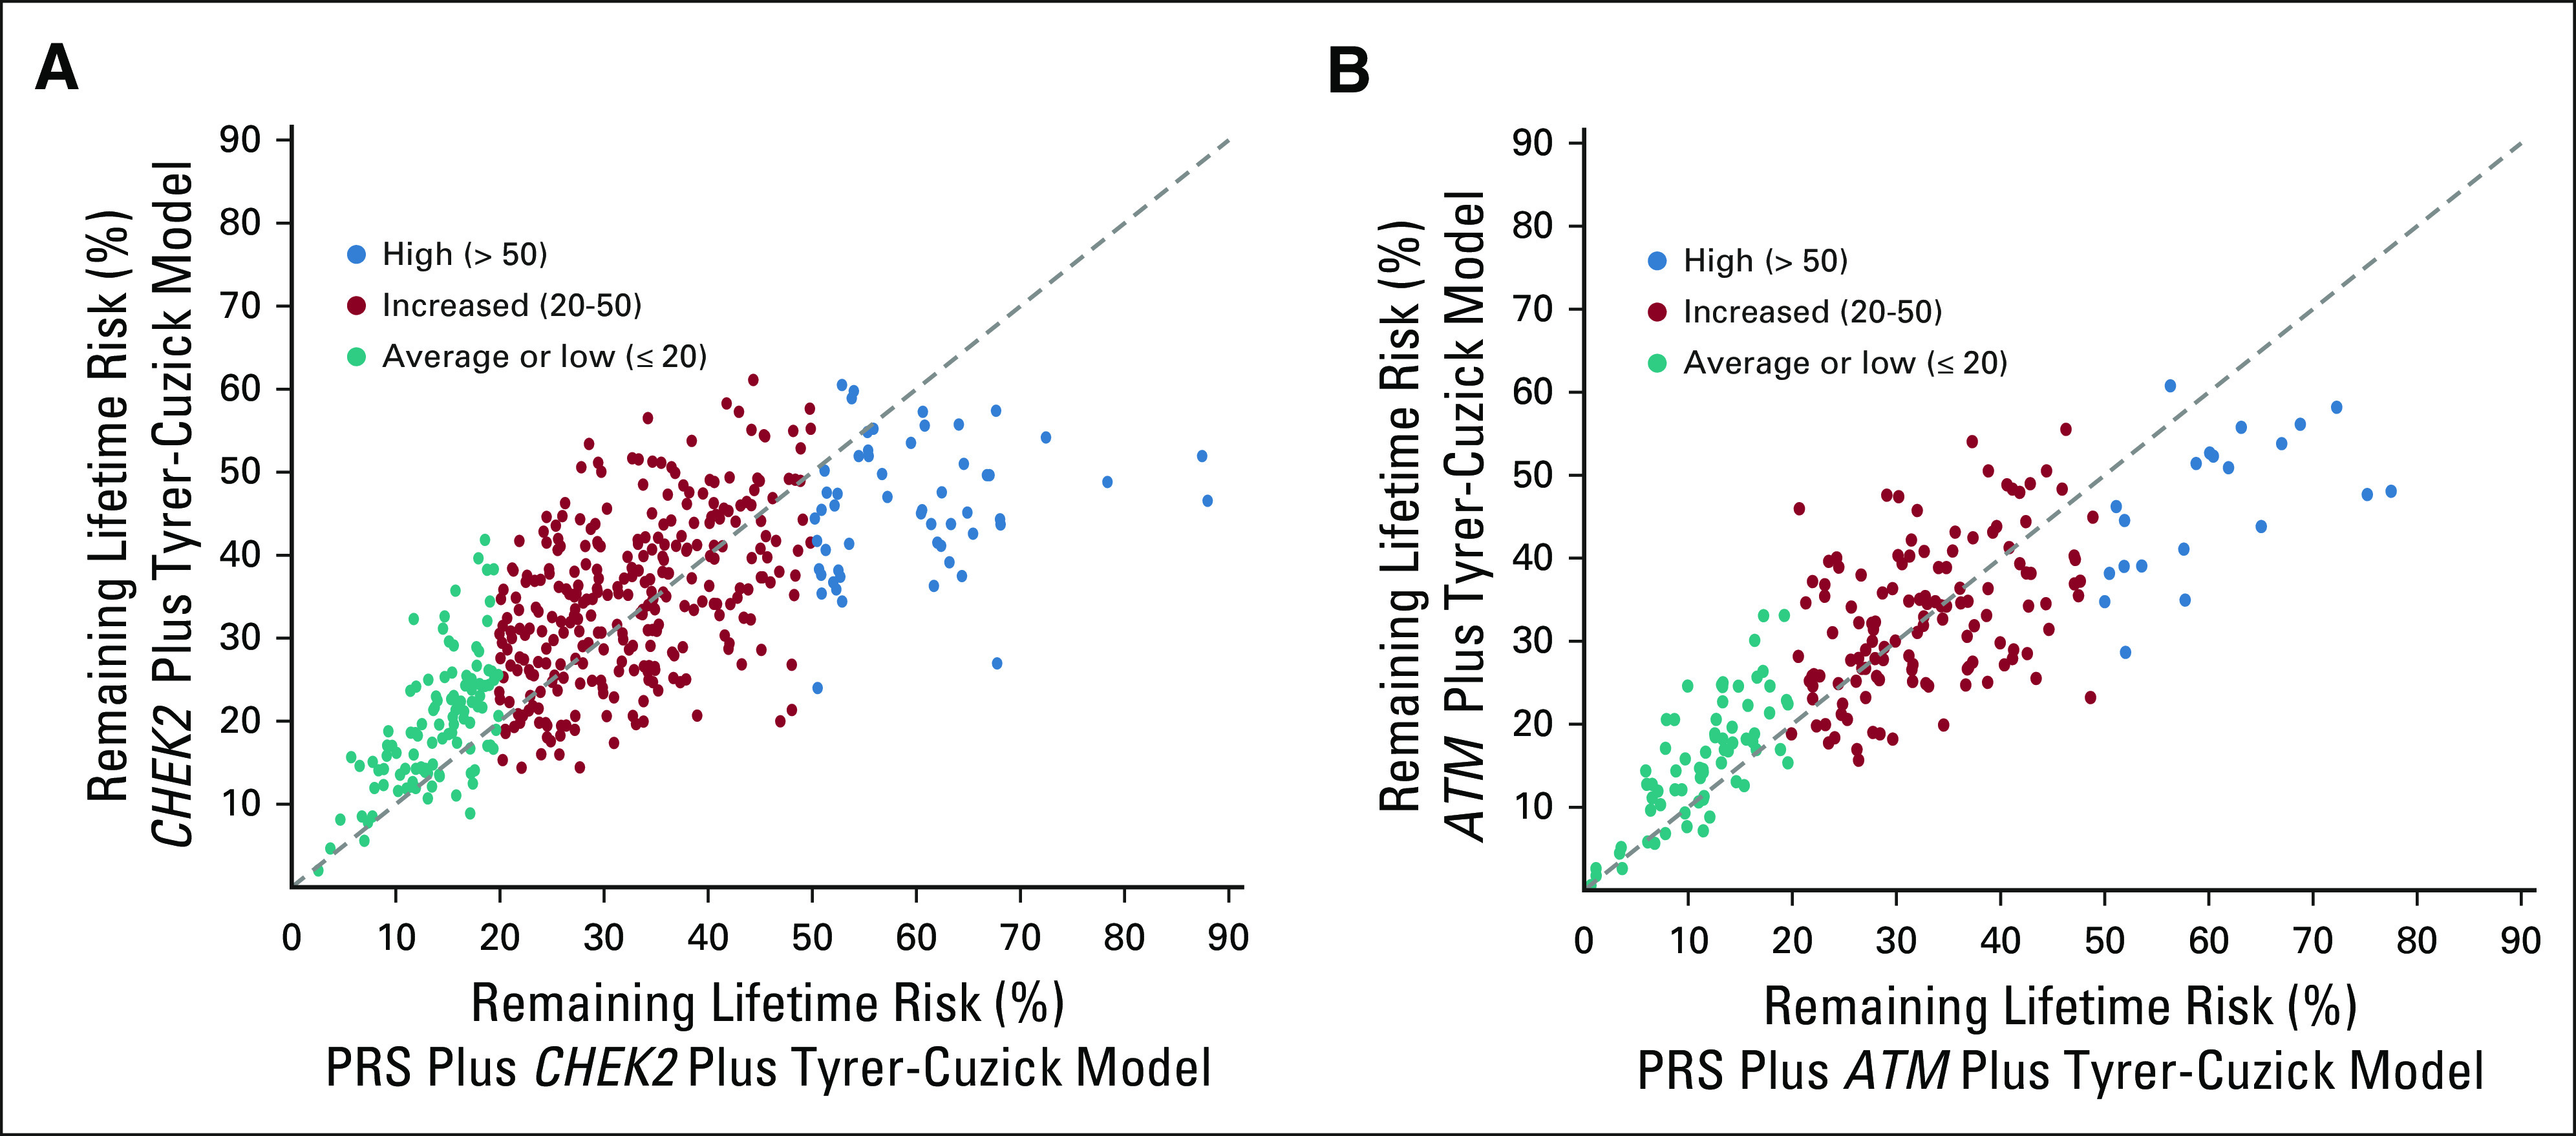
FIG 2.

Scatterplot of risk distribution for (A) unaffected CHEK2 PV carriers (n = 459) or (B) unaffected ATM PV carriers (n = 216) on the basis of CHEK2 and Tyrer-Cuzick alone or with the addition of the 86-SNP PRS. PRS, polygenic risk score; PV, pathogenic variant; SNP, polygenic risk score.
