
Figure 6.
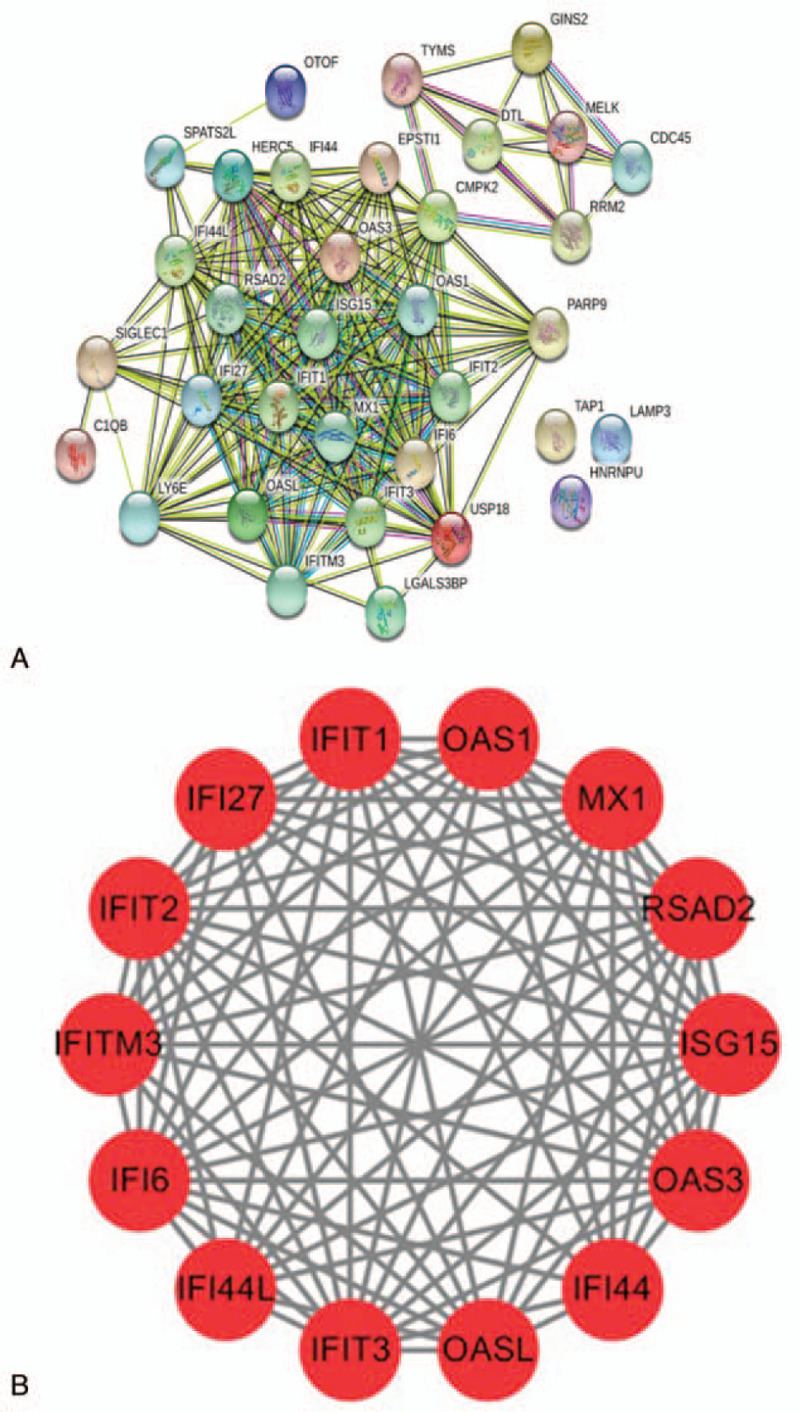
The protein–protein interaction (PPI) networks of the DEGs. (a) The PPI network with a total of 152 DEGs. The color represents the degree of the nodes. (b) The model PPI network was identified according to the Molecular Complex Detection scores (MCODE score = 12.923). DEGs = differentially expressed genes; MCODE = Molecular Complex Detection.