
Figure 3.
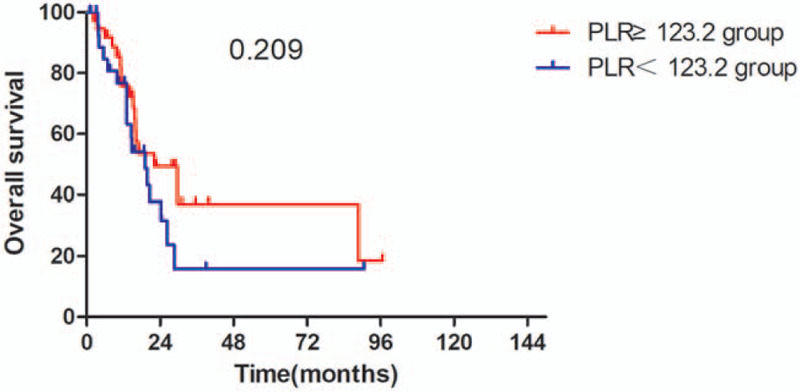
Kaplan–Meier curve for OS in glioma patients stratified by pre-NLR. OS = overall survival, NLR = neutrophil-to-lymphocyte ratio.
Official websites use .gov
A
.gov website belongs to an official
government organization in the United States.
Secure .gov websites use HTTPS
A lock (
) or https:// means you've safely
connected to the .gov website. Share sensitive
information only on official, secure websites.
Kaplan–Meier curve for OS in glioma patients stratified by pre-NLR. OS = overall survival, NLR = neutrophil-to-lymphocyte ratio.