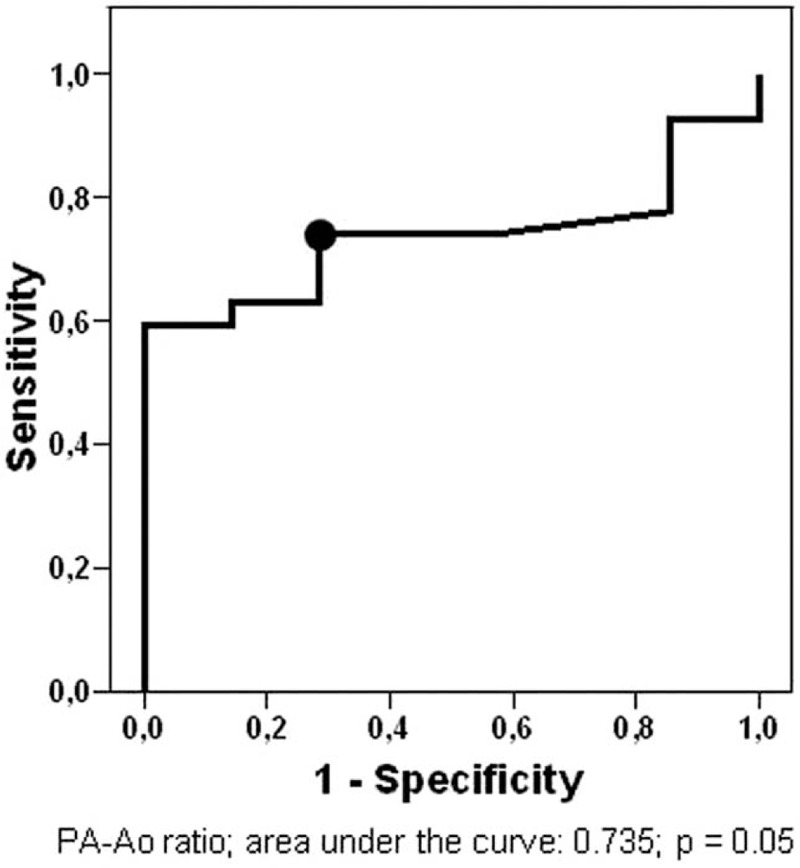
Figure 2.

ROC curve for PA-Ao ratio for predicting the presence of PH on RHC in LAM and PLCH patients. Black dot mark cutoff value for the PA-Ao ratio (0.86) with the highest accuracy. Ao = ascending aorta, LAM = lymphangioleiomyomatosis, PA = pulmonary artery, PH = pulmonary hypertension, PLCH = pulmonary Langerhans cell histiocytosis, RHC = right heart catheterization, ROC = receiver operating characteristic.
