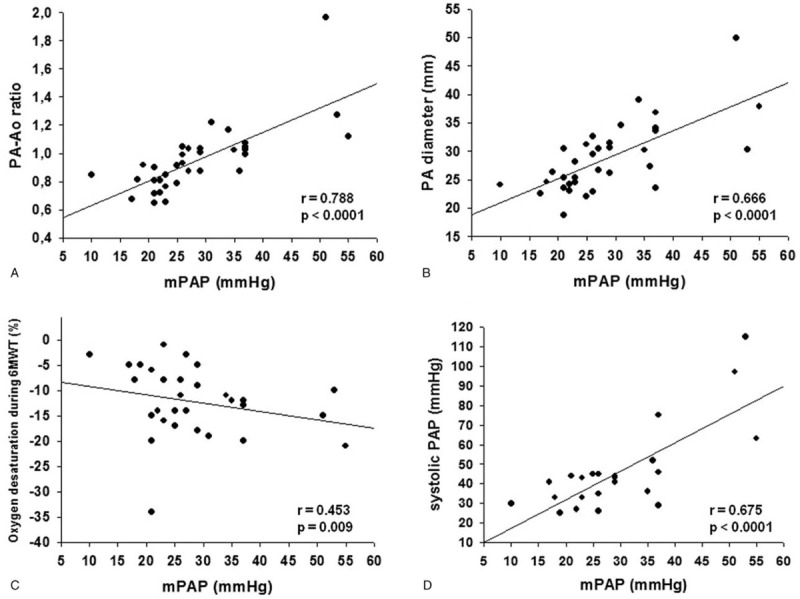
Figure 3.

The best correlations of mPAP (mm Hg) obtained in RHC with tomographic, functional, and echocardiographic were as follows: (A) PA-Ao ratio; (B) PA diameter (mm); (C) oxygen desaturation during 6MWT (%); (D) systolic PAP (mm Hg). 6MWT = six-minute walk test, Ao = ascending aorta, mPAP = mean pulmonary artery pressure, PA = pulmonary artery, PAP = pulmonary artery pressure, r = Spearman correlation coefficient, RHC = right heart catheterization.
