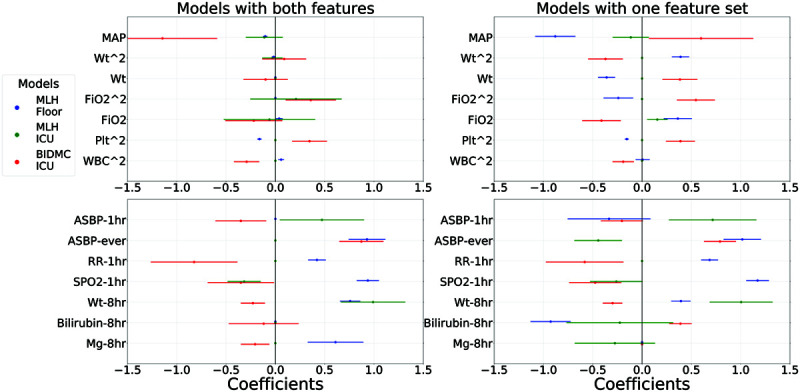
Figure 3.

Learned coefficients from the 4 h models for each of the three cohorts, but only specific features where there is at least one statistically significant difference in sign between coefficients for two different cohorts (as indicated by Wald test p values of <0.05 for both coefficients and with both coefficients of opposite sign). Points are shown for the point estimate of each regression coefficient, along with 95% CIs. Top row shows physiologic features, and the bottom row shows the indicator features. Models trained on Methodist floor data are shown in blue, Methodist ICU data in green, and Beth Israel ICU data in red. Left column shows coefficients from the combined models that use both physiologic and indicators during model fitting, whereas the right column shows results from the models fit separately to only physiology variables (top) and only indicators (bottom). There are six statistically significant sign changes among the physiology-only model coefficients, and all six involved a Beth Israel-derived model. This number decreases to only 2 when examining the combined model and is evidenced that the use of indicators during model fitting helps learn more robust physiologic relationships that generalize better. There are five statistically significant sign changes in both the indicators-only models and the indicator components of the combined models. In both cases, all five again involved a Beth Israel model, along with one significant change between a Methodist floor and ICU model. ASBP = arterial systolic blood pressure, BIDMC = Beth Israel Deaconess Medical Center, MAP = mean arterial pressure, MLH = Methodist LeBonheur Healthcare, Plt = platelets, RR = respiration rate.
