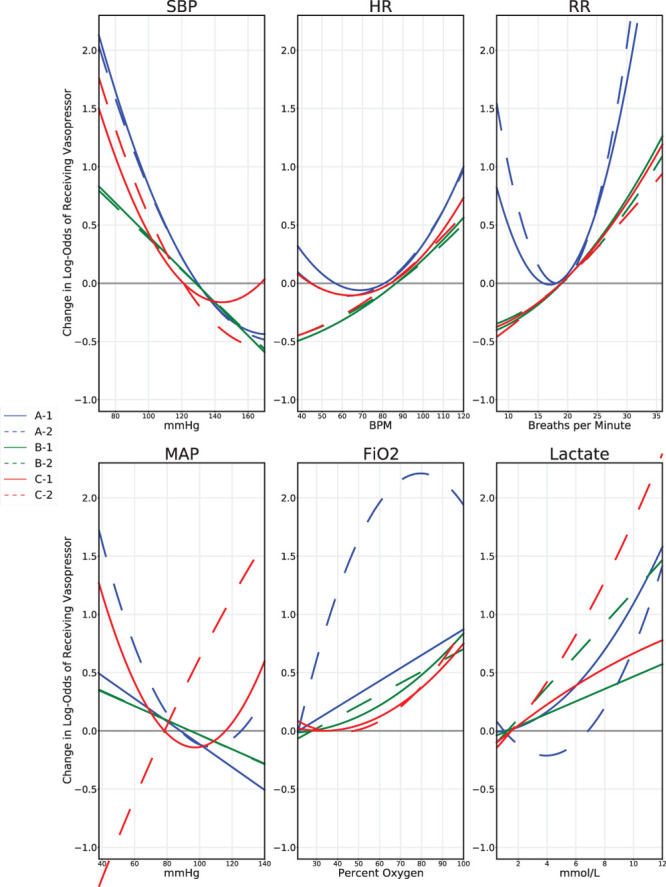
Figure 4.

Visualizations of model predictions for different physiologic variables are shown, from the 4-hr onset models. Each pane shows a different predictor variable. From top left, clockwise, they are: systolic blood pressure (SBP), heart rate (HR), respiration rate (RR), mean arterial pressure (MAP), Fio2, and lactate. Models with a name beginning with “A” were fit from the Methodist floor data and appear in blue throughout. Models with a name beginning with “B” were fit from the Methodist ICU data and appear in green throughout. Models with a name beginning with “C” were fit from the Beth Israel ICU data and appear in red throughout. Models with a name ending in “−1” are the combined models that use both physiologic and measurement indicator variables; their lines are solid. Models with a name ending in “−2” are the models that use only physiologic variables during model fitting; their lines are dashed. The curves indicate a model’s change in log-odds of risk of vasopressor as a function of that predictor variable on the x-axis. The y-axis is shifted such that 0 coincides with the mean of each feature value; the units on the y-axis are relative and not absolute, only denoting change in log-odds as a function of modifying this single predictor. Variables displayed in the top row are examples of predictors where there were no major changes between the combined model and physiology-only models. The difference in RR between the Methodist floor cohort and the two ICU cohorts likely reflects the fact that ICU patients are more likely to be on ventilators. The bottom row shows examples of predictors where there were large changes between the combined and physiologic-only models. The bizarre MAP relationship learned by the Beth Israel ICU physiology-only model is corrected in the combined model, with low MAP associated with higher risk of vasopressor need. Likewise, the strange fitted curves learned by the Methodist floor model for Fio2 and for lactate appear more reasonable in the combined model.
