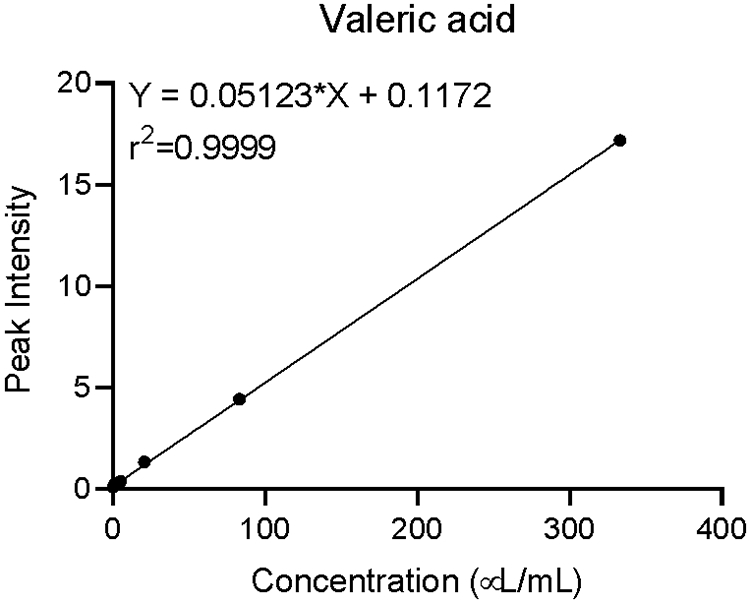
Figure 4.

Calibration curve for valeric acid plotted as concentration vs peak intensity. A calibration curve is created by first preparing a set of standard solutions with known concentrations of the analyte; the instrument response is measured for each and plotted vs. concentration of the standard solution.
