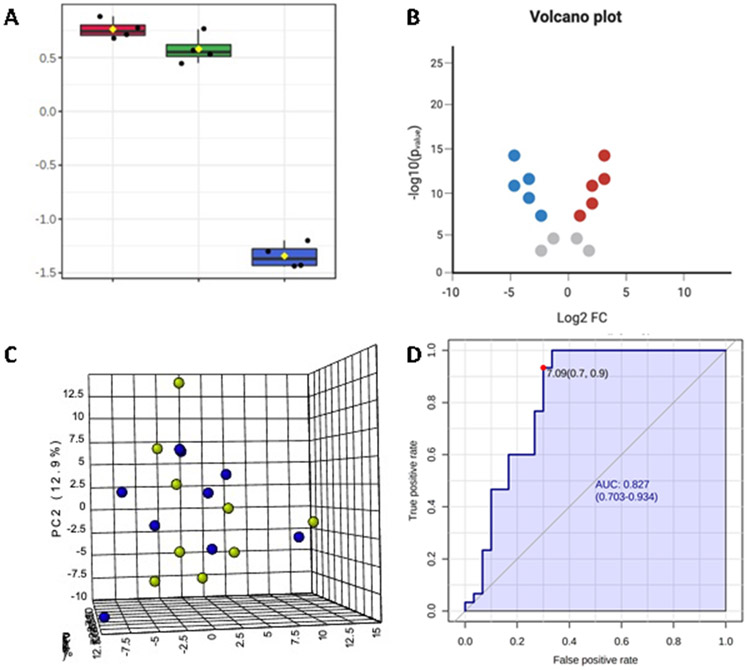
Figure 5.
Examples of typical data analyses that can be used for the 14 SCFAs from human serum and fecal samples: A) Box plot of one-way ANOVA showing log-transformed concentrations in a conventional three-group study design, B) Volcano plot of significant SCFAs and fold-change magnitude between two experimental groups, C) Principal components analysis (PCA) of two groups (green/blue) between three PC components, and D) Receiver operating characteristic (ROC) curve of multivariate model for discrimination between two experimental groups.

