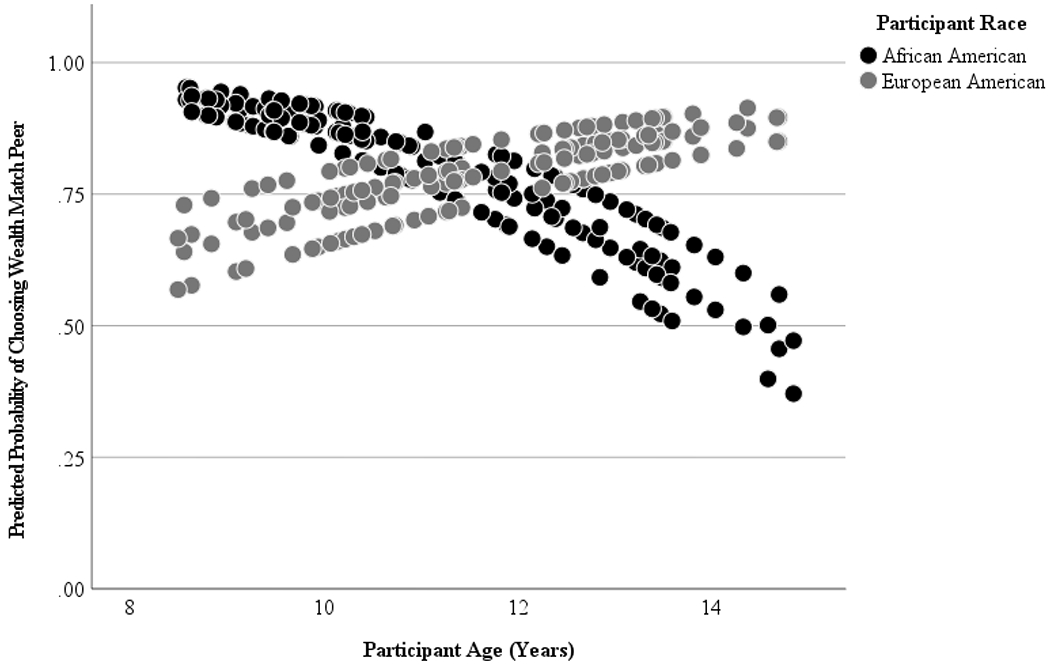
Figure 1. Children’s Expectations for Clubs’ Inclusion Choices By Participant Age and Race.

Note. Circles indicate predicted probabilities of choosing the wealth match peer (1) over the race match peer (0) by participant age and race, where black circles represent African American participants and grey circles represent European American participants.
