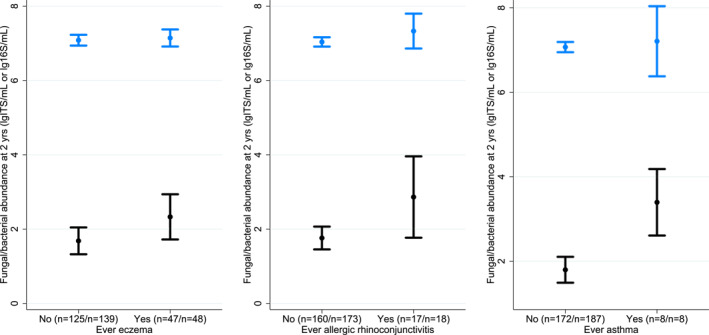
FIGURE 2.

Fungal and bacterial abundance and allergy‐related diseases. These figures depict the mean and 95% CI of fungal (black) and bacterial (blue) abundance at 2 years of age for children with ever allergy‐related disease at 0–6 years, supplementing the logistics regression analyses. The numbers within brackets represent the number of participants in each group for fungal and bacterial analysis, respectively
