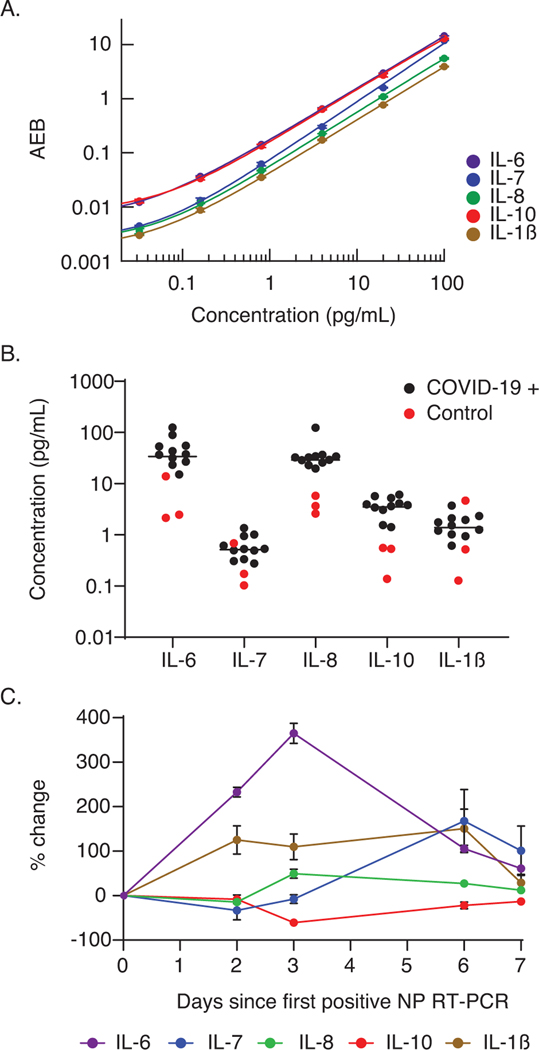
Figure 5.
Serial monitoring of cytokine levels in plasma using sequential multiplex Simoa assays. A) Calibration curves for the five-plex sequential multiplex Simoa assay; cytokines IL-6 (purple), IL-7 (blue), IL-8 (green), IL-10 (red), and IL-1𝛽 (brown) were measured in this assay. Each curve is fit by 4PL regression. Error bars represent the standard deviation of duplicate measurements. B) Measured concentrations of five cytokines from three healthy (red circles) and 11 COVID-19-positive (black circles) individuals. Each marker represents the average of duplicate measurements. C) Percentage changes in cytokine levels in five serial samples collected from one individual who tested positive for COVID-19. The percentage change was calculated relative to the day of the first positive NP RT-PCR. Error bars represent the standard deviation of duplicate measurements.

