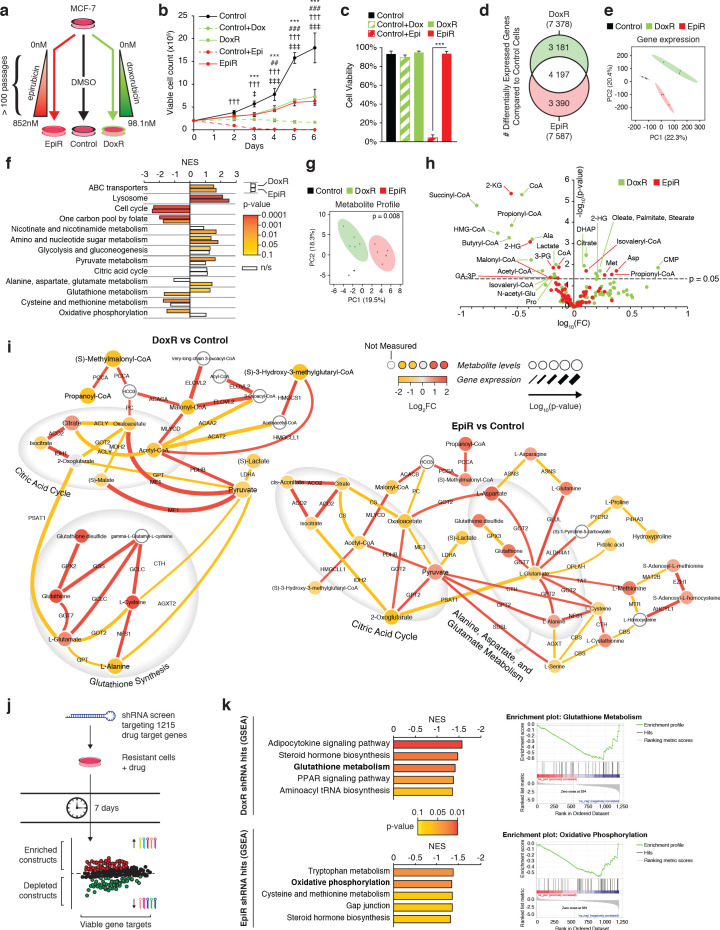
Figure 1. Transcriptomic and metabolomic analyses uncover distinct metabolic alterations in doxorubicin and epirubicin resistant breast cancer cells, compared to anthracycline-sensitive Control cells.
(a) Model detailing stepwise generation of Control, DoxR, and EpiR breast cancer cells, as previously described (Hembruff et al., 2008). (b) Viable cell number of anthracycline-resistant cells in the presence of drugs and anthracycline-treated Control cells compared to untreated Control (DMSO). N = 4, ***p<0.001 Control vs Control +Dox, ##p<0.01 ###p<0.001 DoxR vs Control +Dox, †††p<0.001 Control vs Control +Epi, ‡p<0.05 ‡‡‡p<0.001 EpiR vs Control +Epi (two-way ANOVA, Tukey’s multiple comparison test). (c) Viability of anthracycline-resistant cells and treated or untreated (DMSO) Control cells after 7 days growth. N = 4, ***p<0.001 (paired Student’s t-test). (d) Venn diagram of differentially expressed genes in DoxR or EpiR cells compared to Control cells. Legend: green (differentially expressed in DoxR only), red (differentially expressed in EpiR only), and white (differentially expressed in both). N = 3. (e) Principal component analysis of global gene expression profiling between Control, DoxR, and EpiR cells. N = 3. (f) Gene set enrichment analysis (GSEA) of DoxR and EpiR cells compared to Control cells (KEGG database, N = 3). Data are shown as normalized enrichment score (NES) for DoxR and EpiR, where color designates the p-value associated with each enrichment (from yellow at p=0.1 to red at p=0.0001) and where white bars designate non-significant enrichments (n/s, p>0.1). (g) Partial least squares discriminant analysis of metabolite profile data between Control, DoxR, and EpiR cells. N = 6, p=0.008 (1000 permutations). (h) Volcano plot of metabolite profile of DoxR and EpiR cells compared to Control cells (N = 6). Significant features (p<0.05, paired Student’s t-test) highlighted. (i) Integrated metabolic network analysis of DoxR (left) and EpiR (right) cells compared to Control cells. Metabolites are represented by nodes, with p-value represented by node size. Enzymes are represented by edges, with p-value of gene expression represented by edge thickness. Direction and magnitude of fold changes in gene expression and metabolite abundance are represented on a yellow (depleted in resistant) to red (enriched in resistant) color scale. Major pathways are highlighted in shaded areas. (j) Model detailing shRNA screen targeting 1215 drug target genes. Changes in shRNA barcode abundance were measured after 7 days, and viable gene targets were ranked by p-value and fold change of target shRNA abundance. Depleted shRNA were considered cytotoxic or cytostatic to resistant cells in the presence of drug, while enriched barcodes were considered to promote cell proliferation or survival. (k) (left) Top five metabolic pathways identified by Gene Set Enrichment Analysis (KEGG database) of ranked shRNA gene targets depleted in DoxR (top) and EpiR (bottom) cells. (right) GSEA plots detailing enrichment of key metabolic pathways identified in DoxR cells (Glutathione Metabolism, top) or EpiR (Oxidative Phosphorylation, bottom). All data presented as averages ± S.E.M. (b-c).


