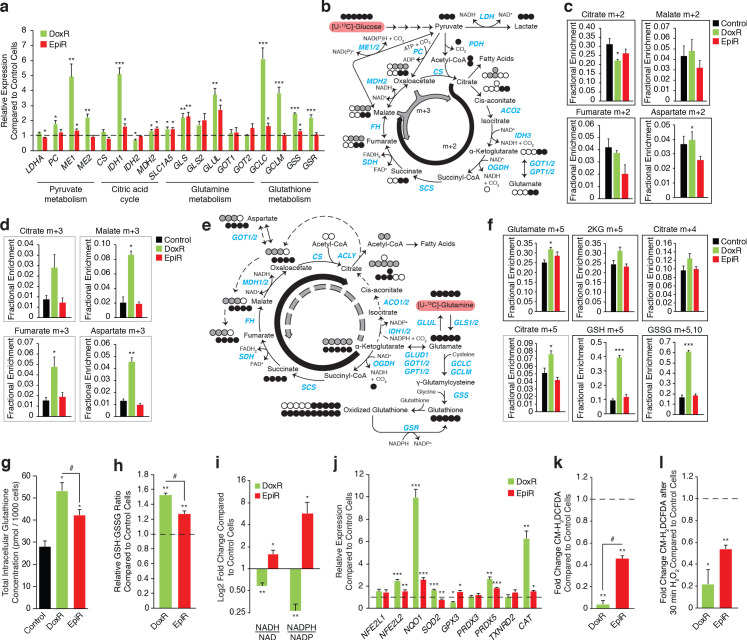
Figure 2. Doxorubicin-resistant breast cancer cells fuel anaplerotic metabolism by altering glucose and glutamine metabolism.
(a) Relative expression of pyruvate metabolism, citric acid cycle, and glutamine and glutathione metabolism genes in DoxR and EpiR compared to Control cells. N = 3–6, *p<0.05 **p<0.01 ***p<0.001 resistant versus Control cells (paired Student’s t-test). (b) Stable isotope tracing diagram for [U-13C]-Glucose through glycolysis and into the citric acid cycle via pyruvate dehydrogenase (PDH, black) and adjacent pathways (gray). (c) [U-13C]-Glucose tracing into the citric acid cycle via PDH (citrate, malate, fumarate, and aspartate m + 2, 30 min tracer) in Control, DoxR, and EpiR cells expressed as fractional enrichment. N = 4, *p<0.05 resistant versus Control cells (paired Student’s t-test). (d) [U-13C]-Glucose tracing to glutamate (m + 2) via PDH and into the citric acid cycle via PC or ME1/2 activity (citrate, malate, fumarate, and aspartate m + 3, 30 min tracer) in Control, DoxR, and EpiR cells expressed as fractional enrichment. N = 4, *p<0.05 **p<0.01 resistant versus Control cells (paired Student’s t-test). (e) Stable isotope tracing diagram for [U-13C]-Glutamine into the citric acid cycle, glutathione synthesis, and adjacent pathways. Reductive carboxylation pathway shown in gray. (f) [U-13C]-Glutamine tracing to glutamate and into the citric cycle (2KG m + 5, citrate m + 4 and m + 5, 60 min tracer) or through to glutathione (GSH m + 3,5 and GSSG m + 3,5,6,8,10, 4 hr tracer) in Control, DoxR, and EpiR cells expressed as fractional enrichment. N = 4, *p<0.05 ***p<0.001 resistant versus Control cells (paired Student’s t-test). (g) Total intracellular glutathione concentration in Control, DoxR and EpiR cells. N = 4, *p<0.05 resistant vs Control cells, #p<0.05 DoxR vs EpiR cells (paired Student’s t-test). (h) Fold change in GSH:GSSG ratio of DoxR and EpiR cells compared to Control cells. N = 4, **p<0.01 resistant vs Control, #p<0.05 DoxR vs EpiR cells (paired Student’s t-test). (i) Fold change in NADH/NAD and NADPH/NAD ratio of DoxR and EpiR cells compared to Control cells. N = 6, *p<0.05 **p<0.01 resistant versus Control cells (paired Student’s t-test). Data are shown on a log2 scale. (j) Relative expression of oxidative response genes in DoxR and EpiR cells compared to Control cells. N = 4–7, *p<0.05 **p<0.01 ***p<0.001 resistant vs Control cells (paired Student’s t-test). (k) Fold change of ROS signal in DoxR and EpiR cells compared to Control cells, detected by CM-H2DCFDA. N = 3, **p<0.01 resistant vs Control cells, #p<0.05 DoxR vs EpiR cells (paired Student’s t-test). (l) Fold change of ROS signal in DoxR and EpiR compared to Control cells, after 30-min treatment with 0.03% H2O2. N = 3, *p<0.05 **p<0.01 resistant vs Control cells (paired Student’s t-test). All data presented as averages ± S.E.M.
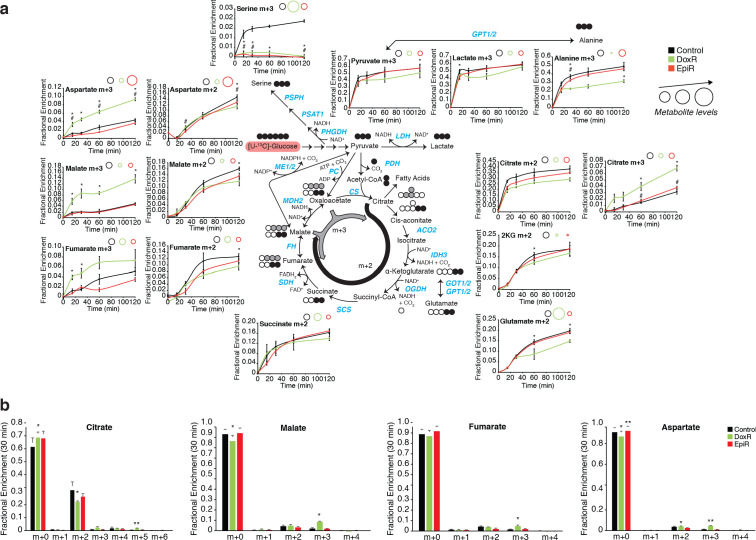
Figure 2—figure supplement 1. [U-13C]-glucose tracing of Control, DoxR, and EpiR breast cancer cells.
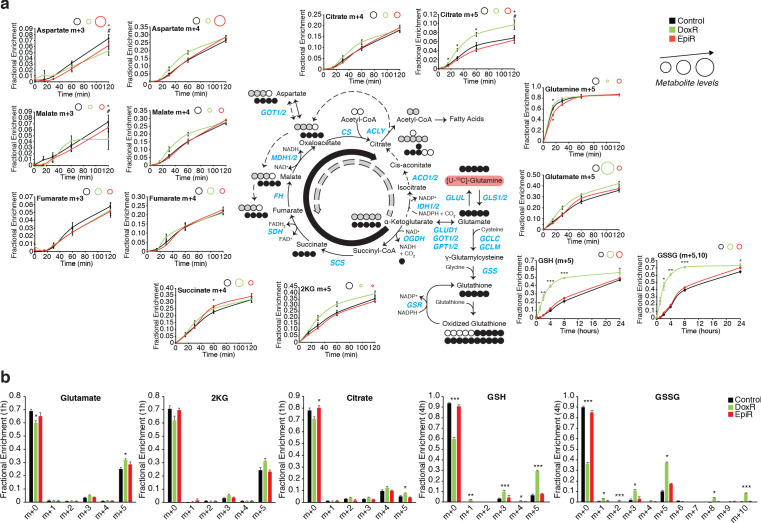
Figure 2—figure supplement 2. [U-13C]-glutamine tracing of Control, DoxR, and EpiR breast cancer cells.
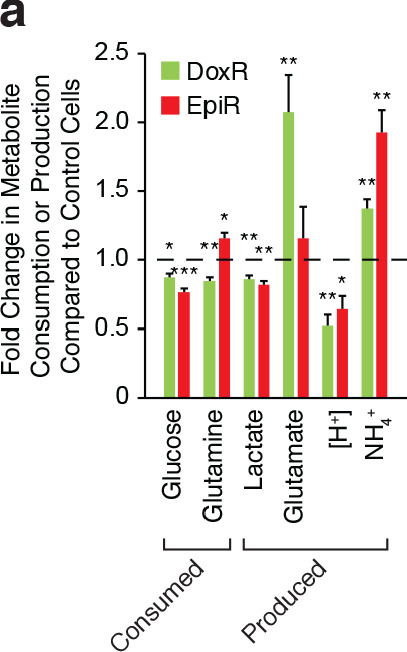
Figure 2—figure supplement 3. Media metabolite composition of Control, DoxR, and EpiR breast cancer cells.


