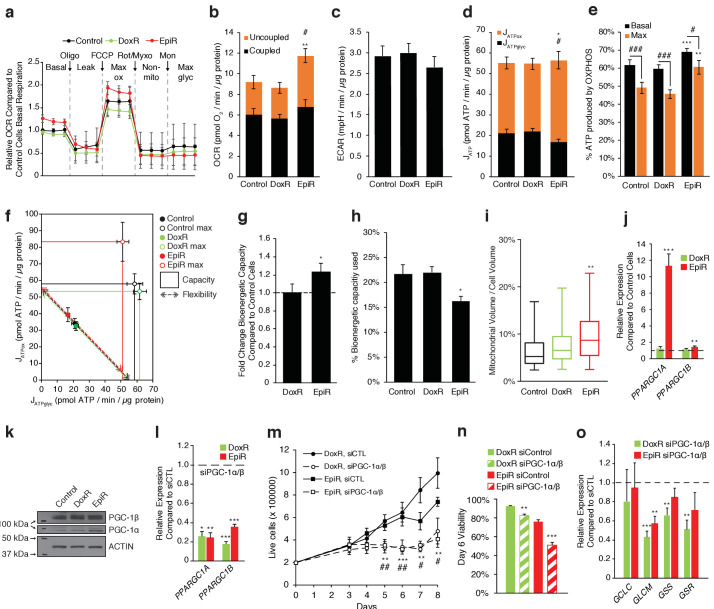
Figure 3. PGC-1α is overexpressed and elevates OXPHOS capacity in epirubicin-resistant cells but is essential for sustaining growth and survival in both doxorubicin and epirubicin resistant breast cancer cells.
(a) Analysis of relative basal, leak (oligomycin), maximum (FCCP), and non-mitochondrial (rotenone and myxothiazol) respiration, as well as after addition of monensin, in Control, DoxR, and EpiR cells. All values normalized to basal respiration in Control cells. N = 9. (b) Quantification of coupled, uncoupled, and total Oxygen Consumption Rate (OCR) in Control, DoxR, and EpiR cells. N = 9, **p<0.01 uncoupled #p<0.05 total, resistant vs Control cells (paired Student’s t-test). (c) Quantification of basal Extracellular Acidification Rate (ECAR) in Control, DoxR, and EpiR cells. N = 9. (d) Quantification of ATP production rate (JATP) from oxidative phosphorylation (JATPox) or glycolysis (JATPglyc) in Control, DoxR, and EpiR cells. N = 9, *p<0.05 JATPox #p<0.05 JATPglyc, resistant vs Control cells (paired Student’s t-test). (e) Proportion of ATP produced by OXPHOS in Control, DoxR, and EpiR cells under basal conditions and at peak bioenergetic capacity (Max). N = 9, **p<0.01 ***p<0.001 resistant vs Control cells, #p<0.05 ##p<0.01 ###p<0.001 Max vs Basal (paired Student’s t-test). (f) Bioenergetic space plots of Control, DoxR, and EpiR cells. Solid points represent basal JATPglyc and JATPox values, hollow points represent theoretical maximums for JATPox (FCCP) and JATPglyc (rotenone, myxothiazol, monensin). Dotted line arrows’ length represents flexibility of ATP production within maximum boundaries (solid lines). Area under maximum boundaries represents the bioenergetic capacity. N = 9. (g) Fold change in bioenergetic capacity of DoxR and EpiR cells compared to Control cells. N = 9, *p<0.05 resistant vs Control cells (paired Student’s t-test). (h) Fraction of bioenergetic capacity used under basal conditions in Control, DoxR, and EpiR cells. N = 9, *p<0.05 resistant vs Control cells (paired Student’s t-test). (i) Quantification of mitochondrial volume as a percentage of total cytoplasmic volume, in Control, DoxR, and EpiR cells. N = 38, **p<0.01 resistant vs Control cells (Kruskal-Wallis test and Dunn’s multiple comparisons test). Data presented as a box plot. (j) Relative expression of PPARGC1A and PPARGC1B mRNA in DoxR and EpiR cells compared to Control cells. N = 7, **p<0.01 ***p<0.001 resistant vs Control cells (paired Student’s t-test). (k) Immunoblots of PGC-1β, PGC-1α, and Actin protein expression in Control, DoxR, and EpiR cells. (l) Relative expression of PPARGC1A and PPARGC1B mRNA in DoxR and EpiR 3 days after double siRNA knockdown of PGC-1α and PGC-1β, compared to control siRNA. N = 5, *p<0.05 **p<0.01 ***p<0.001 siPGC-1α/β vs siCTL (paired Student’s t-test). (m) Growth of DoxR and EpiR in the presence of anthracyclines (dox 98.1 nM or epi 852 nM) with double siRNA knockdown of PGC-1α and PGC-1β or control siRNA. N = 5, **p<0.01 ***p<0.001 DoxR siPGC-1α/β vs DoxR siCTL, #p<0.05 ##p<0.01 EpiR siPGC-1α/β vs EpiR siCTL (paired Student’s t-test). (n) Cell viability at day 6 of the growth curve shown in d. N = 5, **p<0.01 ***p<0.001 siPGC-1α/β vs siCTL (paired Student’s t-test). (o) Relative expression of glutathione metabolism genes 3 days after double siRNA knockdown of PGC-1α and PGC-1β, compared to control siRNA. N = 5, **p<0.01 ***p<0.001 siPGC-1α/β vs siCTL (paired Student’s t-test). All data presented as averages ± S.E.M.
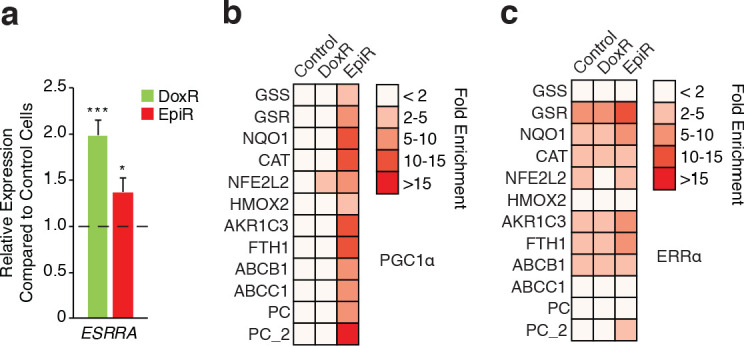
Figure 3—figure supplement 1. PGC-1α and ERRα are enriched at the promoters of key metabolic and resistance-associated genes.


