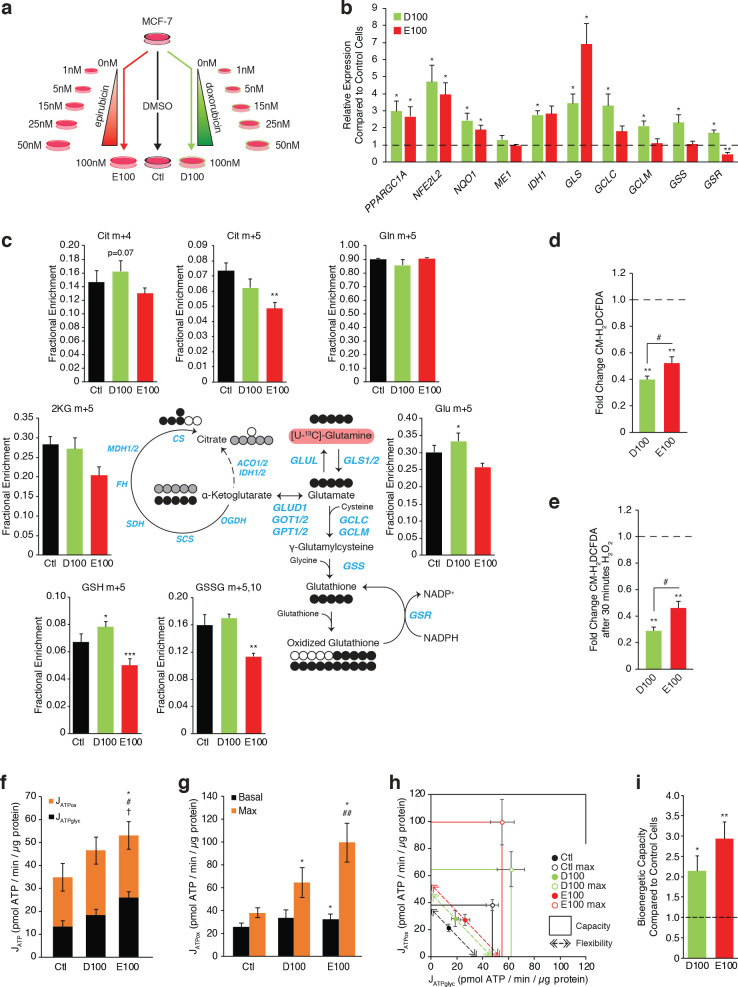
Figure 5. Independently derived resistant models confirm specific metabolic adaptations to doxorubicin and epirubicin.
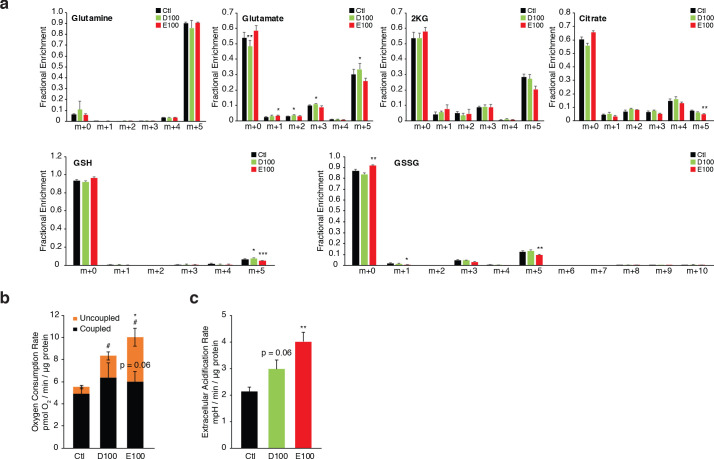
(a) Model detailing generation of breast cancer cells resistant to increasing concentrations of anthracyclines, to a final stable extracellular concentration of 100 nM of doxorubicin (D100) or epirubicin (E100). Control cells (Ctl) were maintained in DMSO in parallel passages. (b) Relative expression of PPARGC1A and selected metabolic, glutathione, and oxidative response genes in D100 and E100 compared to Ctl. N = 3–6. *p<0.05 resistant vs Ctl cells (paired Student’s t-test). (c) [U-13C]-Glutamine tracing to glutamate and into the citric cycle (2 KG m + 5, citrate m + 4 and m + 5, malate m + 3, 2 hr tracer) or through to glutathione (GSH m + 5 and GSSG m + 5,10, 4 hr tracer) in Ctl, D100, and E100 expressed as fractional enrichment. N = 3–5, *p<0.05 **p<0.01 ***p<0.001 resistant vs Ctl cells (paired Student’s t-test). (d) Fold change of ROS signal in D100 and E100 cells compared to Ctl cells, detected by CM-H2DCFDA staining. N = 5, **p<0.01 resistant vs Control cells, #p<0.05 D100 vs E100 (paired Student’s t-test). (e) Fold change of ROS signal in D100 and E100 compared to Ctl cells, after 30 min treatment with 0.03% H2O2. N = 5, **p<0.01 resistant vs Control cells, #p<0.05 D100 vs E100 (paired Student’s t-test). (f) Quantification of ATP production (JATP) from oxidative phosphorylation (JATPox) or glycolysis (JATPglyc) in Ctl, D100, and E100. N = 5, *p<0.05 JATPox #p<0.05 JATPglyc †p<0.05 JATP, resistant vs Ctl cells (paired Student’s t-test). (g) Quantification of ATP production by OXPHOS (JATPox) in Ctl, D100 and E100 cells under basal conditions and at peak bioenergetic capacity (Max). N = 5, *p<0.05 resistant vs Ctl cells, ##p<0.01 E100 vs D100 (paired Student’s t-test). (h) Bioenergetic space plots of Ctl, D100, and E100. Solid points represent actual JATPglyc and JATPox values, hollow points represent maximums for JATPox (FCCP) and JATPglyc (rotenone, myxothiazol, monensin). Length of dotted line arrows represents flexibility of ATP production within maximum boundaries (solid lines). Area under maximum boundaries represents the bioenergetic capacity. N = 5. (i) Fold change in bioenergetic capacity of D100 and E100 compared to Ctl. N = 5 *p<0.05 **p<0.01 resistant vs Ctl cells (paired Student’s t-test). All data presented as averages ± S.E.M.


