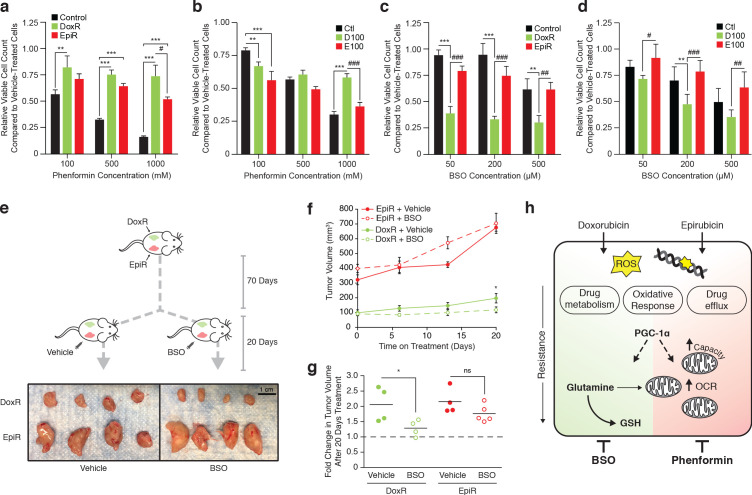
Figure 6. Tailored metabolic adaptations underpinning resistance to doxorubicin and epirubicin lead to primary actionable vulnerabilities in vitro and in vivo.
(a) Relative viable cell count of Control, DoxR, and EpiR cells after 3 days treatment with a combination of phenformin and their respective drug (DMSO, 98.1 nM doxorubicin, or 852 nM epirubicin). Data are shown as relative viable cell count of phenformin-treated cells compared to cells treated with vehicle (water). N = 4, *p<0.05 **p<0.01 ***p<0.001 resistant vs Control cells, #p<0.05 DoxR vs EpiR cells (paired Student’s t-test). (b) Relative viable cell count of Ctl, D100, and E100 cells after 3 days treatment with a combination of phenformin and their respective drug (DMSO, 100 nM doxorubicin, or 100 nM epirubicin). Data are shown as relative viable cell count of phenformin-treated cells compared to cells treated with vehicle (water). N = 4, **p<0.01 ***p<0.001 resistant vs Ctl cells, ***p<0.001 D100 vs E100 cells (paired Student’s t-test). (c) Relative viable cell count of Control, DoxR, and EpiR cells after 3 days treatment with a combination of buthionine sulfoximine (BSO) and their respective drug (DMSO, 98.1 nM doxorubicin, or 852 nM epirubicin) after 7 weeks of drug holiday. Data are shown as relative viable cell count of BSO-treated cells compared to cells treated with vehicle (water). N = 3, **p<0.01 ***p<0.001 resistant vs Control cells, ##p<0.01 ###p<0.001 DoxR vs EpiR cells (paired Student’s t-test). (d) Relative viable cell count of Ctl, D100, and E100 cells after 3 days treatment with a combination of BSO and their respective drug (DMSO, 100 nM doxorubicin, or 100 nM epirubicin). Data are shown as relative viable cell count of BSO-treated cells compared to cells treated with vehicle (water). N = 3, **p<0.01 resistant vs Control cells, #p<0.05 ##p<0.01 ###p<0.001 D100 vs E100 cells (paired Student’s t-test). (e) Picture of end-point DoxR and EpiR tumors after 70 days of growth in the opposing mammary fat pads of NOD Scid Gamma mice supplemented twice weekly with subcutaneous injection of 5 µg estrogen, followed by 20 days with daily intraperitoneal injection of either 450 mg/kg BSO or vehicle (PBS). (f) Volume of DoxR and EpiR tumors measured over 20 days with daily treatments of either 450 mg/kg BSO or vehicle (PBS) by intraperitoneal injection. Data are shown as tumor volume on day 0, 6, 13, and 20. N = 4–5, *p<0.05 BSO vs vehicle (two-way ANOVA, Sidak’s post-hoc test). (g) Fold change in DoxR and EpiR tumor volumes after 20 days of daily treatment with either 450 mg/kg BSO or vehicle (PBS) by intraperitoneal injection. Data are shown as fold changes for individual tumors, relative to baseline tumor volume at day 0 (dotted line). The average fold change for each condition is shown by horizontal lines. N = 4–5, *p<0.05 BSO vs vehicle (Student’s t-test). (h) Schematic of common adaptation mechanisms and distinct primary metabolic dependencies in anthracycline resistant breast cancer cells. Doxorubicin and epirubicin both induce production of reactive oxygen species (ROS) and intercalate nucleic acids and inhibit topoisomerase II, leading to double-strand DNA breaks. Both doxorubicin- and epirubicin-resistant cells engage oxidative response, drug metabolism, and drug efflux pathways to overcome these drug mechanisms, and both are dependent on expression of PGC-1α for their survival. PGC-1α-regulated pathways may further underpin distinct and context-dependent metabolic adaptations to either drug. Compared to drug-sensitive control cells, doxorubicin-resistant cells rely on glutamine for de novo glutathione (GSH) synthesis and for mitochondrial ATP production, while epirubicin-resistant cells display elevated mitochondrial content, oxygen consumption rate (OCR), and oxidative bioenergetic capacity. These distinct primary metabolic dependencies are actionable, as epiribucin-resistant cells are more sensitive to phenformin treatment than doxorubicin-resistant cells, and the latter are specifically sensitive to inhibition of glutathione synthesis by buthionine sulfoximine (BSO) both in vitro and in vivo. Unless otherwise noted, all data presented as averages ± S.E.M.

