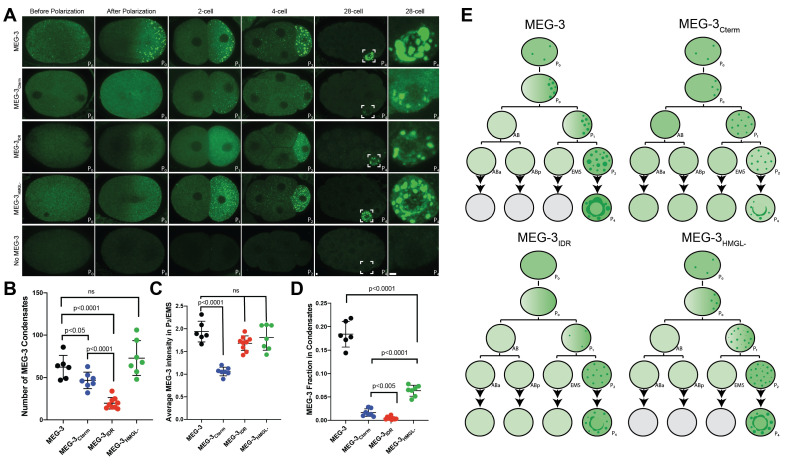
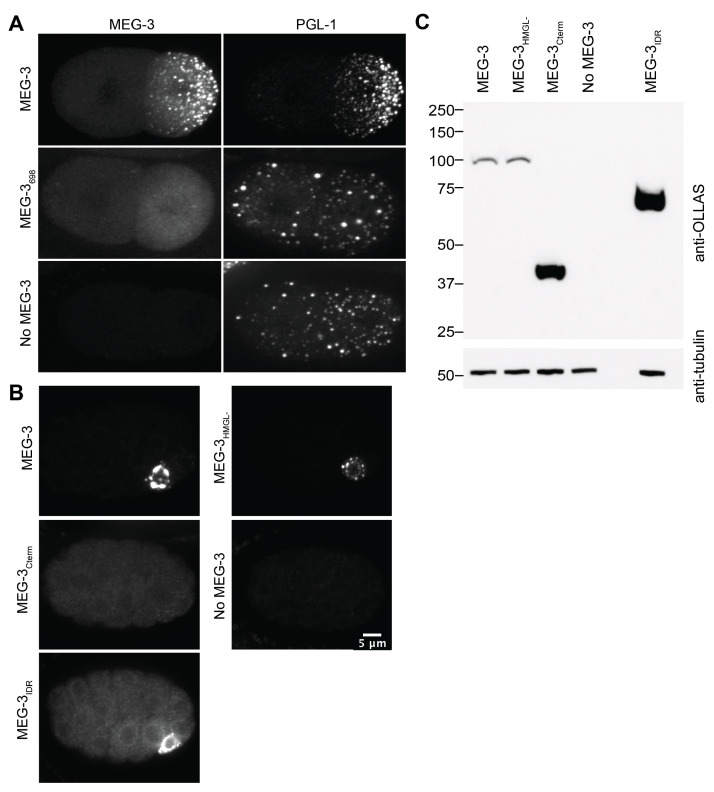
Figure 2. Localization of wild-type MEG-3 and variants in early embryos.
(A) Representative photomicrographs of embryos immunostained for OLLAS and expressing the indicated OLLAS-tagged MEG-3 derivatives. Last row shows meg-3 meg-4 embryos as negative control for OLLAS staining. Images are representative of stages indicated above each column. Before and after polarization are one-cell stage zygotes, other stages are indicated by the total number of cells in each stage. The name of the P (germ) blastomere is indicated in the bottom right of each image. A minimum of three embryos from two independent experiments were analyzed for each stage. Scale bars are 1 μm. All images are maximum projections normalized to same fluorescent intensity range except for the last column showing high-magnification views of P4 from the 28-cell stage image adjusted to highlight MEG-3 granules. (B) Scatterplot showing the number of MEG-3 condensates in the P2 blastomere in embryos expressing the indicated MEG-3 derivatives. Each dot represents an embryo. (C) Scatterplot showing enrichment of MEG-3 in the P2 blastomere over the somatic blastomere (EMS), calculated by dividing the average intensity in P2 by the average intensity in EMS. Each dot represents an embryo also included in the analysis shown in (B). (D) Scatterplot showing the fraction of the MEG-3 signal localized to condensates over total signal in P2. Each dot represents an embryo also included in the analysis in (B). (E) Summary of MEG-3 (green) distribution derived from data presented in (A). Each row corresponds to a different stage as in (A), starting with unpolarized zygote, polarized zygote, 2-cell, 4-cell, and 28-cell stage. Horizontal lines denote one-cell division, arrows indicate multiple divisions. Note that wild-type MEG-3 and MEG-3HMGL- are rapidly turned over in somatic cells after the four-cell stage (gray cells) as shown in Figure 2—figure supplement 1B, C.


