Figure 5.

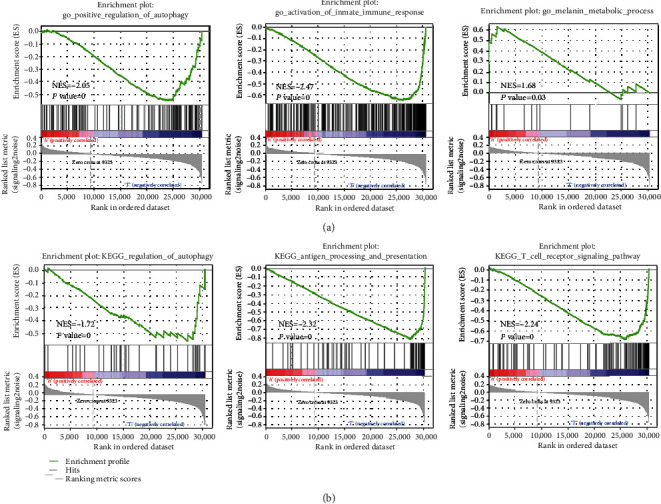
GSEA: (a) biological processes in melanoma; (b) KEGG analysis comparing the high- and low-risk groups. GSEA: gene set enrichment analysis; KEGG: Kyoto Encyclopedia of Genes and Genomes.

GSEA: (a) biological processes in melanoma; (b) KEGG analysis comparing the high- and low-risk groups. GSEA: gene set enrichment analysis; KEGG: Kyoto Encyclopedia of Genes and Genomes.