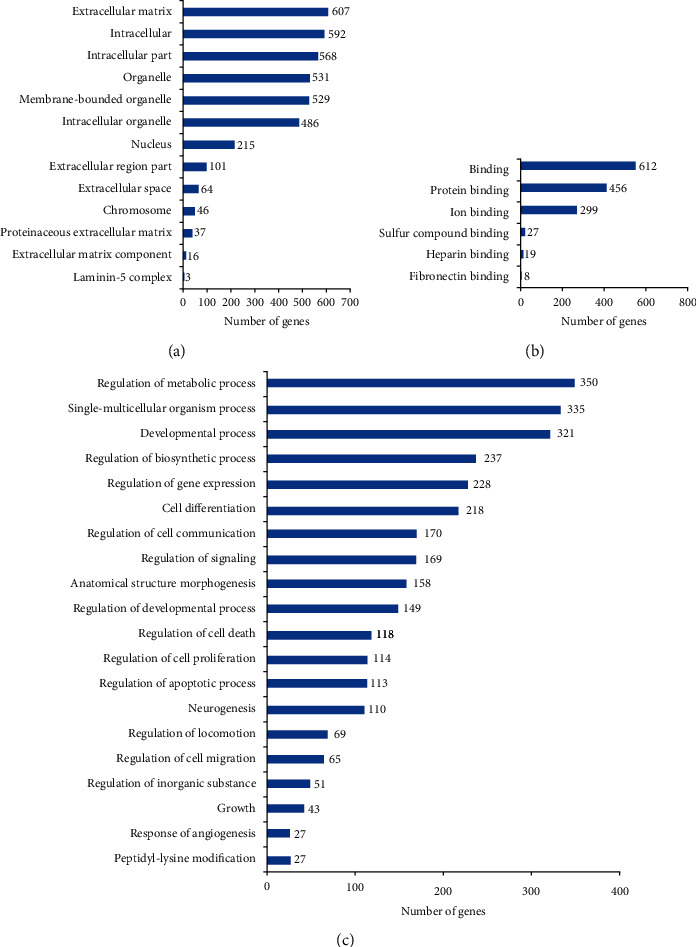
Figure 5.

Histogram display of GO enrichment analysis of DEGs. The results are divided into three categories: cellular components, molecular functions, and biological processes. The x-axis represents the number of DEGs corresponding to the GO term, and the y-axis represents the name of the GO term [15].
