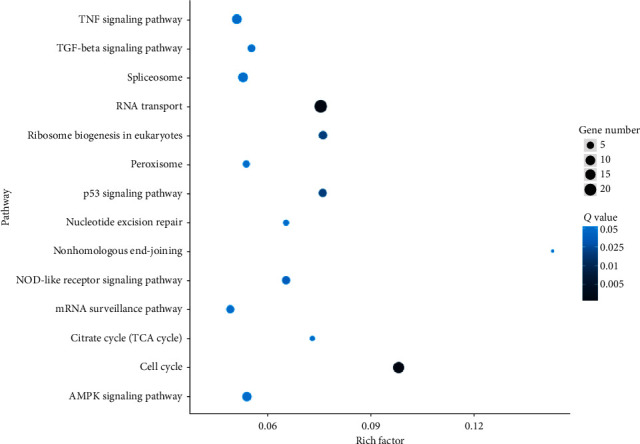
Figure 6.

Scatter plot display of KEGG enrichment analysis of DEGs. The x-axis represents the enrichment factor, representing the proportion of DEGs involved in the KEGG pathway among all identified DEGs, and the y-axis represents the enrichment pathway. The size of the dot reflects the number of DEGs, and the color of the dot reflects the adjusted p value (Q value).
