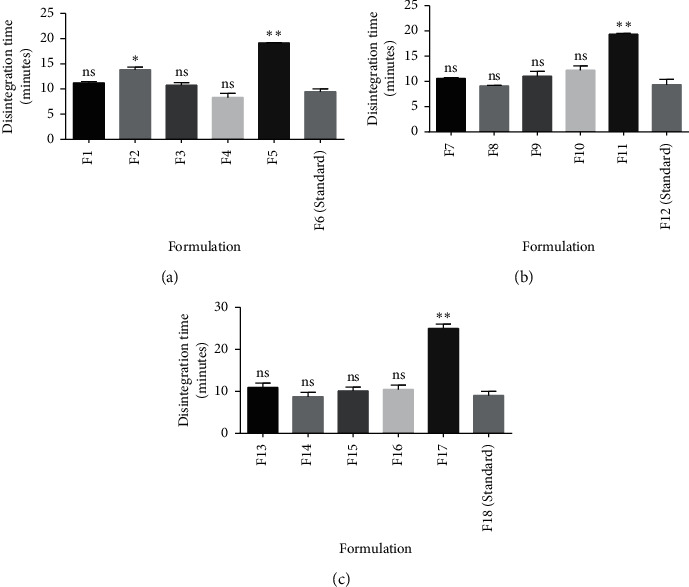
Figure 6.

Comparative analysis on the disintegration time of pectin from various genotypes as disintegrants ((a) 5% w/w, (b) 7.5% w/w, and (c) 10% w/w) and a standard disintegrant using t-test. Values are mean ± SD (n = 2). ∗p ≤ 0.05, ∗∗p ≤ 0.01, and p > 0.05 not significant (ns).
