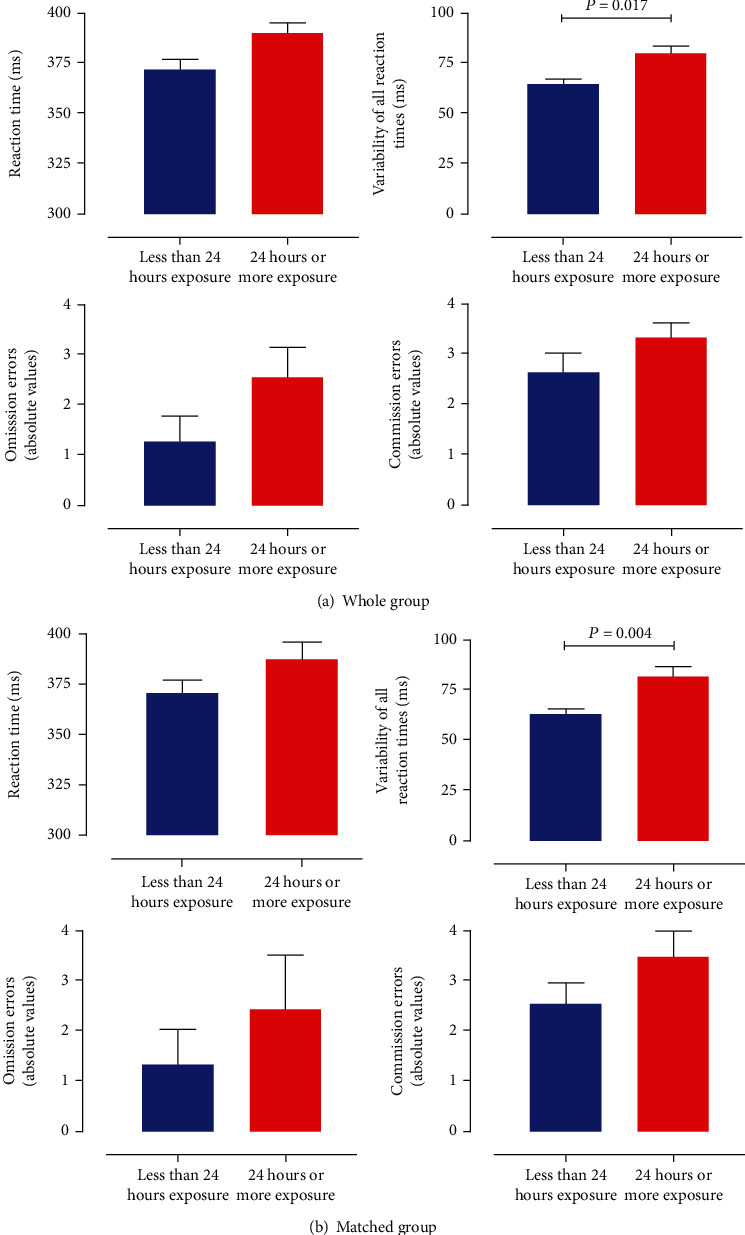
Figure 2.

(a) Bar graphs of the mean reaction time of the correct responses, mean variability of all reaction times of the correct responses, and mean omission and commission errors with standard error of the mean of the analysis with all participants included. (b) Bar graphs of the mean reaction time of the correct responses, mean variability of all reaction times of the correct responses, and mean omission and commission errors with standard error of the mean of the analysis of both groups matched for size. Blue bars depict participants with minimal COVID-19 exposure, and red bars represent those with substantial exposure to COVID-19 patients.
