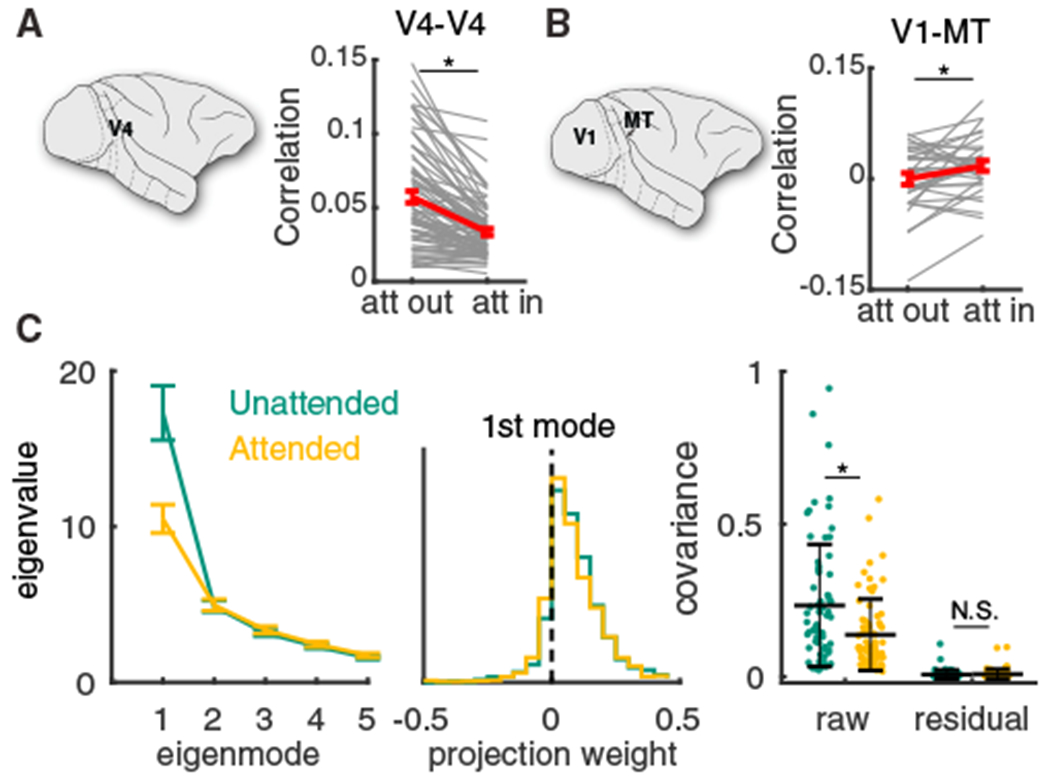
Figure 1. Attentional Modulation of Population Variability within and between Cortical Areas.

(A) Mean spike count correlation rSC per session obtained from multi-electrode array recording from V4 was smaller when attention was directed into the receptive fields of recorded neurons (n = 74 sessions, two-sided Wilcoxon rank-sum test between attentional states, p = 3.3 × 10⁻⁶; reproduced from Cohen and Maunsell, 2009). Gray lines are individual session comparisons and the red line is the mean comparison across all sessions (error bars represent the SEM).
(B) Same as (A) for the mean spike count correlation rSC between V1 units and MT units per session (n = 32 sessions, paired-sample t test, p = 0.0222; data reproduced from Ruff and Cohen, 2016a).
(C) Left: the first five largest eigenvalues of the shared component of the spike count covariance matrix from the V4 data (Cohen and Maunsell, 2009). Green, unattended; orange, attended; data from n = 72 sessions with 43 ± 15 neurons. Error bars are SEM. Middle: the vector elements for the first (dominant) eigenmode. Right: the mean covariance from each session in attended and unattended states before (raw) and after (residual) subtracting the first eigenmode (mean ± SD in black). Two-sided Wilcoxon rank-sum test (attended versus unattended), mean covariance, p = 1.3 × 10⁻³; residual, p = 0.75.
